Mouse pancreatic endocrinogenesis (scATAC-seq) | Model evaluation
Model assessment
Here we compared the weights learned by several model iterations, to highlight
Performance user parameter combinations
Interpretation based on TF regulators
Coherence or learned graph-weights when assisting RNA-weights, or only using ATAC-weights
print('here...')
here...
%load_ext autoreload
%autoreload 2
If you wish to test this notebook but have not trained models, you can download example output from this cloud link. Dropbox URL
Four files are required
Model output (*.pth) using GraphLayer (log_dynamic=1) and not using it (log_dynamic=0)
ATAC (atac_train) and RNA (rna_sample_train).
Training dataloader (train_dataloader).
If a file for testing is n/a, or there are clarifications while loading, please reach out via Github.
# pip install matplotlib==3.7.2
import torch
import mubind as mb
import scanpy as sc
# the prepring case (4148)
# Graph Layer with hadamard product 8161 x 50000
n_obs = 8161
n_var = 50000
save_code = '_obs%i_var%i' % (n_obs, n_var)
# load models
model_by_logdynamic = {}
for use_logdynamic in [False, True]:
    p = "pancreas_multiome_use_logdynamic_%i_obs8161_var50000.pth" % use_logdynamic
    print(p)
    model_by_logdynamic[use_logdynamic] = torch.load(p)
pancreas_multiome_use_logdynamic_0_obs8161_var50000.pth
pancreas_multiome_use_logdynamic_1_obs8161_var50000.pth
!ls -ltrh /home/ilibarra/workspace/theislab/mubind/docs/notebooks/single_cell/atac_train*
-rwxrwxrwx 1 ilibarra ilibarra 289K Aug 27 00:03 /home/ilibarra/workspace/theislab/mubind/docs/notebooks/single_cell/atac_train.h5ad
-rwxrwxrwx 1 ilibarra ilibarra 209M Aug 30 12:10 /home/ilibarra/workspace/theislab/mubind/docs/notebooks/single_cell/atac_train_obs8161_var50000.h5ad
# this loads the atac and RNA objects subsampled and used during training
ad = sc.read_h5ad('atac_train%s.h5ad' % save_code)
rna_sample = sc.read_h5ad('rna_sample_train_obs%i.h5ad' % (n_obs))
import pickle


train = pickle.load(open('train_dataloader%s.pkl' % save_code, "rb"))
%load_ext line_profiler
!readlink -f .
/mnt/c/Users/IgnacioIbarra/Dropbox/workspace/theislab/mubind/docs/notebooks/single_cell
# load the pancreas multiome dataset
rna, atac = mb.datasets.pancreas_multiome(data_directory="../../../../../../annotations/single_cell")
True data/scatac/pancreas_multiome/pancreas_multiome_2022_processed_rna_velocities_2024.h5ad
True data/scatac/pancreas_multiome/pancreas_multiome_2022_processed_atac.h5ad
reading ATAC
opening ATAC successful
# %lprun -f model.forward model.optimize_iterative(train, n_epochs=10, skip_kernels=list([0]) + list(range(2, 500)), opt_kernel_shift=[0, 0] + [0] * (n_kernels), opt_kernel_length=[0, 0] + [0] * (n_kernels))
# %lprun -f model.binding_modes.forward model.optimize_iterative(train, n_epochs=10, skip_kernels=list([0]) + list(range(2, 500)), opt_kernel_shift=[0, 0] + [0] * (n_kernels), opt_kernel_length=[0, 0] + [0] * (n_kernels))
import matplotlib.pyplot as plt
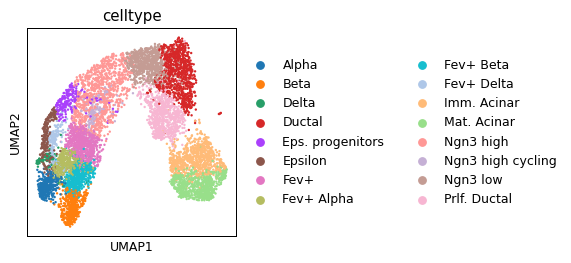
cell_type_key = "celltype"
for optimize_log_dynamic in model_by_logdynamic:
print("Graph Layer | ", optimize_log_dynamic)
model = model_by_logdynamic[optimize_log_dynamic]
# print(optimize_log_dynamic)
from matplotlib import rcParams
rcParams["figure.figsize"] = 10, 5
rcParams["figure.dpi"] = 100
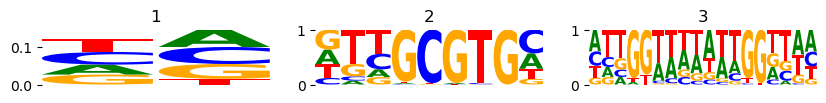
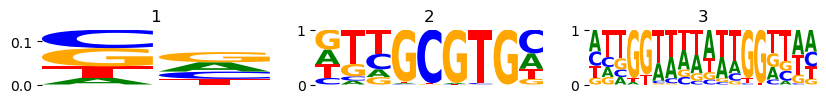
mb.pl.logo(model, n_cols=3, show=True, n_rows=6, stop_at=4) # log=True)
plt.show()
Graph Layer |  False
break
Graph Layer |  True
break
for optimize_log_dynamic in model_by_logdynamic:
if not optimize_log_dynamic:
continue
model = model_by_logdynamic[optimize_log_dynamic]
print(optimize_log_dynamic)
tsum = torch.sum
texp = torch.exp
tspa = torch.sparse_coo_tensor
tsmm = torch.sparse.mm
t = torch.transpose
# connectivities
C = model.graph_module.conn_sparse
a_ind = C.indices()
log_dynamic = model.graph_module.log_dynamic
D = model.graph_module.log_dynamic
D_tril = tspa(a_ind, D, C.shape) # .requires_grad_(True).cuda()
D_triu = tspa(a_ind, -D, C.shape) # .requires_grad_(True).cuda()
D = D_tril + t(D_triu, 0, 1)
# log_dynamic = log_dynamic + -torch.transpose(log_dynamic, 0, 1)
# triu_indices = torch.triu_indices(row=n_rounds, col=n_rounds, offset=1)
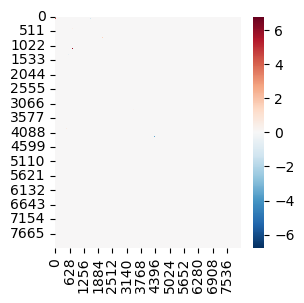
import seaborn as sns
mb.pl.set_rcParams({"figure.figsize": [3, 3]})
sns.heatmap(D.to_dense().detach().cpu(), cmap="RdBu_r")
plt.show()
True
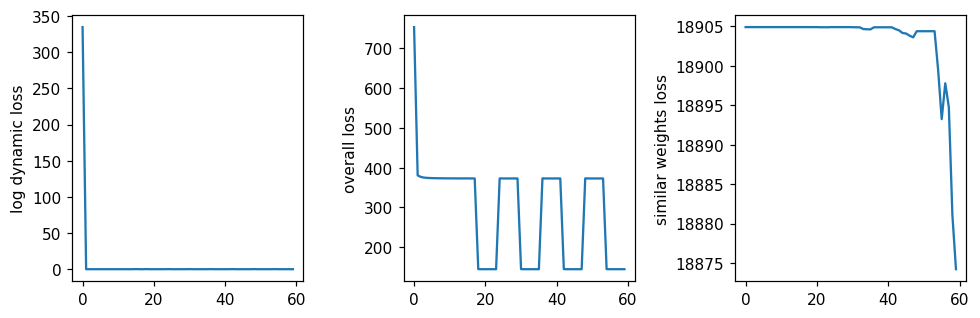
model = model_by_logdynamic[1]
mb.pl.set_rcParams({"figure.figsize": [12, 3], "figure.dpi": 110})
plt.subplot(1, 4, 1)
plt.plot(model.loss_history_log_dynamic)
plt.ylabel("log dynamic loss")
plt.subplot(1, 4, 2)
plt.plot(model.loss_history)
plt.ylabel("overall loss")
plt.subplot(1, 4, 3)
plt.plot(model.loss_history_sym_weights)
plt.ylabel("similar weights loss")
plt.tight_layout()

plt.savefig('losses_pancreatic_endocrinogenesis.pdf')
plt.show()
import pandas as pd
import numpy as np
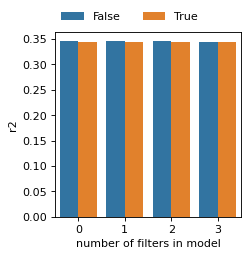
rcParams["figure.figsize"] = 3, 5
r2_all = []
for optimize_log_dynamic in model_by_logdynamic:
    print(optimize_log_dynamic)
    model = model_by_logdynamic[optimize_log_dynamic]
    # contributions per newly added kernel
    import seaborn as sns

    if len(model.best_r2_by_new_filter) != 0:
        r2 = pd.DataFrame(model.best_r2_by_new_filter, columns=["r2"]).reset_index()
        r2["opt_log_dynamic"] = optimize_log_dynamic
        r2_all.append(r2)

if len(r2_all) > 0:
    r2_all = pd.concat(r2_all)
    rcParams["figure.figsize"] = 3, 3
    rcParams["figure.dpi"] = 80
    ax = sns.barplot(
        data=r2_all,
        x="index",
        y="r2",
        hue="opt_log_dynamic",
    )
    sns.move_legend(ax, "lower center", bbox_to_anchor=(0.4, 1), ncol=3, title=None, frameon=False)

    plt.xlabel("number of filters in model")
    plt.show()
False
True
model = model_by_logdynamic[True]
torch.set_printoptions(precision=2)
dynamic_score = D.to_dense().detach().cpu().sum(axis=0)
# dyn_score
dynamic_score = dynamic_score
dynamic_score = (dynamic_score - dynamic_score.min()) / (dynamic_score.max() - dynamic_score.min())
ad.obs["dynamic_score"] = dynamic_score
ad.obs["dynamic_score_cluster"] = np.where(dynamic_score > dynamic_score.mean(), "dynamic", "static")
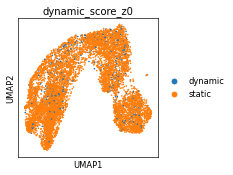
z0 = np.where(((dynamic_score - dynamic_score.mean()) / dynamic_score.std()) > 0.75, "dynamic", "static")
z1 = np.where(((dynamic_score - dynamic_score.mean()) / dynamic_score.std()) > 1, "dynamic", "static")
z2 = np.where(((dynamic_score - dynamic_score.mean()) / dynamic_score.std()) > 2, "dynamic", "static")
ad.obs["dynamic_score_z0"] = z0
ad.obs["dynamic_score_z1"] = z1
ad.obs["dynamic_score_z2"] = z2
ad.obs[[c for c in ad.obs if 'dynamic' in c]].describe()
| dynamic_score | |
|---|---|
| count | 8161.000000 |
| mean | 0.308962 |
| std | 0.040538 |
| min | 0.000000 |
| 25% | 0.308942 |
| 50% | 0.308962 |
| 75% | 0.308974 |
| max | 1.000000 |
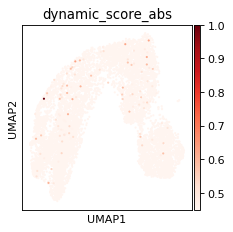
ad.obs["dynamic_score_abs"] = ad.obs["dynamic_score"].abs()
sc.pl.umap(ad, color="dynamic_score_abs", color_map="Reds", vmin=0.45)
# contributions per newly added kernel
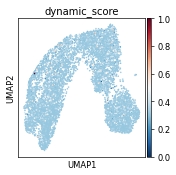
mb.pl.set_rcParams({"figure.figsize": [3, 3], "figure.dpi": 60})
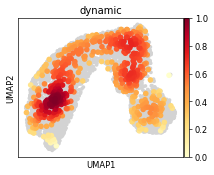
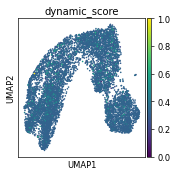
sc.pl.umap(ad, color=["dynamic_score"], cmap="RdBu_r", sort_order=True)
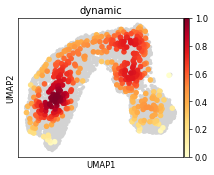
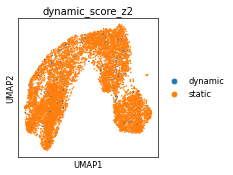
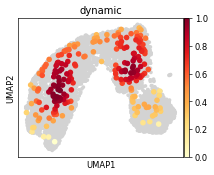
for z in ['z0', 'z1', 'z2']:
print(z)
sc.pl.umap(ad, color=["dynamic_score_%s" % z], cmap="RdBu_r", sort_order=True)
sc.tl.embedding_density(ad, basis="umap", groupby="dynamic_score_%s" % z)
sc.pl.embedding_density(
ad, basis="umap", key="umap_density_dynamic_score_%s" % z, group="dynamic"
) # basis='umap', groupby='dynamic_score_cluster')
z0
z1

z2
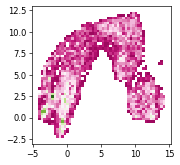
import seaborn as sns

umap = ad.obsm["X_umap"]
sns.histplot(x=umap[:, 0], y=umap[:, 1], bins=50, cmap="PiYG")
<Axes: >
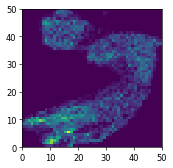
plt.pcolormesh(np.histogram2d(umap[:, 0], umap[:, 1], bins=50)[0])
<matplotlib.collections.QuadMesh at 0x7fc886ceadc0>
x, y = np.meshgrid(umap[:, 0], umap[:, 1])
x = umap[:, 1]  # array_txt[:,0]
y = umap[:, 1]  # array_txt[:,1]
z = ad.obs["dynamic_score"].values  # array_txt[:,2]
sc.pl.umap(ad, color="dynamic_score")
import matplotlib.pyplot as plt
import numpy as np
rcParams["figure.figsize"] = 5, 3
# generate 2 2d grids for the x & y bounds
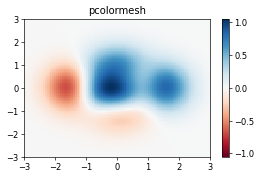
y, x = np.meshgrid(np.linspace(-3, 3, 100), np.linspace(-3, 3, 100))
z = (1 - x / 2.0 + x**5 + y**3) * np.exp(-(x**2) - y**2)
z = z[:-1, :-1]
z_min, z_max = -np.abs(z).max(), np.abs(z).max()
fig, ax = plt.subplots()
c = ax.pcolormesh(x, y, z, cmap="RdBu", vmin=z_min, vmax=z_max)
ax.set_title("pcolormesh")
# set the limits of the plot to the limits of the data
ax.axis([x.min(), x.max(), y.min(), y.max()])
fig.colorbar(c, ax=ax)
plt.show()
import itertools
import numpy as np


def grid(x, y, z, size_x=1, size_y=1):

    def pairwise(iterable):
        "s -> (s0,s1), (s1,s2), (s2, s3), ..."
        a, b = itertools.tee(iterable)
        next(b, None)
        return zip(a, b)

    minx, maxx = int(min(x)), int(max(x)) + 1
    miny, maxy = int(min(y)), int(max(y)) + 1

    result = []
    x_edges = pairwise(np.arange(minx, maxx + 1, size_x))
    for xleft, xright in x_edges:
        xmask = np.logical_and(x >= xleft, x < xright)
        y_edges = pairwise(np.arange(miny, maxy + 1, size_y))
        for yleft, yright in y_edges:
            ymask = np.logical_and(y >= yleft, y < yright)
            cell = z[np.logical_and(xmask, ymask)]
            result.append(cell.sum())

    result = np.array(result).reshape((maxx - minx, maxy - miny))
    return np.flip(result.T, 0)
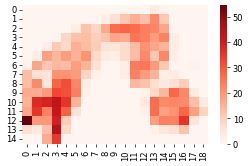
grid_dyn_score = grid(umap[:, 0], umap[:, 1], ad.obs["dynamic_score"], size_x=1, size_y=1)
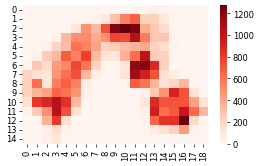
grid_counts = grid(umap[:, 0], umap[:, 1], ad.obs["celltype"].cat.codes.values, size_x=1, size_y=1)
sns.heatmap(grid_dyn_score, cmap="Reds")
plt.show()
sns.heatmap(grid_counts, cmap="Reds")
plt.show()
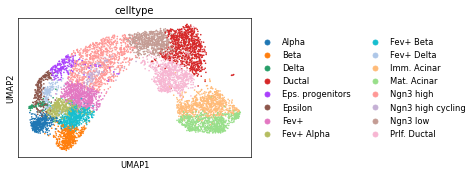
sc.pl.umap(ad, color="celltype")
# for optimize_log_dynamic in model_by_logdynamic:
#     mb.pl.set_rcParams({'figure.figsize': [3, 3], 'figure.dpi': 90})
#     print(optimize_log_dynamic)
#     model = model_by_logdynamic[optimize_log_dynamic]
#     mb.pl.kmer_enrichment(model, train, log_scale=False, style='scatter', ylab='t1', xlab='p1', k=8)
#     plt.show()

#     mb.pl.set_rcParams({'figure.figsize': [10, 7], 'figure.dpi': 90})
#     mb.pl.logo(model,
#                title=False,
#                xticks=False,
#                rowspan_dinuc=0,
#                rowspan_mono=1,
#                n_rows=12,
#                n_cols=3,
#                stop_at=20) # n_cols=len(reduced_groups))
#     plt.show()
model = model_by_logdynamic[True]
G = model.graph_module.conn_sparse.detach().cpu().to_dense() # (C, C)
# number of non_zero weights
len(G[G != 0])
111684
# output = model(**inputs, use_conn=False, return_binding_scores=True)
ad
AnnData object with n_obs × n_vars = 8161 × 50000
    obs: 'n_counts', 'sample', 'n_genes', 'log_genes', 'mt_frac', 'rp_frac', 'ambi_frac', 'nCount_RNA', 'nFeature_RNA', 'nCount_ATAC', 'nFeature_ATAC', 'nucleosome_signal', 'nucleosome_percentile', 'TSS.enrichment', 'TSS.percentile', 'S_score', 'G2M_score', 'phase', 'proliferation', 'celltype', 'nCount_peaks', 'nFeature_peaks', 'dynamic_score', 'dynamic_score_cluster', 'dynamic_score_z0', 'dynamic_score_z1', 'dynamic_score_z2', 'dynamic_score_abs', 'umap_density_dynamic_score_z0', 'umap_density_dynamic_score_z1', 'umap_density_dynamic_score_z2'
    var: 'modality', 'acc_score', 'acc_score_rank', 'chr', 'start', 'end', 'summit', 'summit.start', 'summit.end', 'k.summit'
    uns: 'celltype_colors', 'neighbors', 'dynamic_score_z0_colors', 'umap_density_dynamic_score_z0_params', 'dynamic_score_z1_colors', 'umap_density_dynamic_score_z1_params', 'dynamic_score_z2_colors', 'umap_density_dynamic_score_z2_params'
    obsm: 'X_pca', 'X_pca_wsnn', 'X_spca_wsnn', 'X_umap', 'X_umap_ATAC', 'X_umap_GEX', 'X_umap_wsnn', 'lsi_full', 'lsi_red', 'umap', 'umap_ATAC', 'umap_GEX'
    obsp: 'connectivities', 'connectivities_wnn', 'distances', 'distances_wnn'
model = model.cuda()
device = torch.device("cuda:0" if torch.cuda.is_available() else "cpu")
# device
for optimize_log_dynamic in model_by_logdynamic:
    print(optimize_log_dynamic)
    if not optimize_log_dynamic:
        continue
    model = model_by_logdynamic[optimize_log_dynamic].cuda()

    umap = ad.obsm["X_umap"].copy()
    umap = np.sort(umap, 0)

    x = umap[:, 0]
    y = umap[:, 1]
    X, Y = np.meshgrid(x, y)

    n_points = x.shape[0]
    # x-component to the right
    u = np.ones((n_points, n_points))
    # y-component zero
    v = np.zeros((n_points, n_points))

    pred = []
    binding_per_mode = []
    for i, batch in enumerate(train):
        # Get a batch and potentially send it to GPU memory.
        mononuc = batch["mononuc"].to(device)
        # print(i, mononuc.shape)
        b = batch["batch"].to(device) if "batch" in batch else None
        rounds = batch["rounds"].to(device) if "rounds" in batch else None
        countsum = batch["countsum"].to(device) if "countsum" in batch else None
        seq = batch["seq"] if "seq" in batch else None
        residues = batch["residues"].to(device) if "residues" in batch else None
        if residues is not None and train.dataset.store_rev:
            mononuc_rev = batch["mononuc_rev"].to(device)
            inputs = {"mono": mononuc, "mono_rev": mononuc_rev, "batch": b, "countsum": countsum, "residues": residues}
        elif residues is not None:
            inputs = {"mono": mononuc, "batch": b, "countsum": countsum, "residues": residues}
        elif train.dataset.store_rev:
            mononuc_rev = batch["mononuc_rev"].to(device)
            inputs = {"mono": mononuc, "mono_rev": mononuc_rev, "batch": b, "countsum": countsum}
        else:
            inputs = {"mono": mononuc, "batch": b, "countsum": countsum}

        inputs["scale_countsum"] = model.datatype == "selex"
        output = model(**inputs, use_conn=False, return_binding_scores=True)
        output = output.cpu().detach().numpy()
        # print("here...")
        # print(output.shape)
        # print(output.sum())
        pred.append(output)


        output = model(**inputs, use_conn=False, return_binding_per_mode=True)
        output = output.cpu().detach().numpy()
        # print("here...")
        # print(output.shape)
        # print(output.sum())
        binding_per_mode.append(output)

    # pred = np.concatenate(pred).T

    binding_scores = np.concatenate(pred).T
    binding_per_mode = np.concatenate(binding_per_mode)

    # ad.layers['velocity'] = pred

    # conn = model.graph_module.conn_sparse.detach().cpu()
    # conn = model.graph_module.conn_sparse.detach().cpu().to_dense()
    # v = conn.sum(axis=1)
    # ad.layers['velocity'] = torch.stack([v,] * ad.shape[1], axis=1).numpy()

    # ad.layers['counts'] = ad.X

    # mb.pl.set_rcParams({'figure.figsize': [5, 4], 'figure.dpi': 90})
    # plt.hist(model.graph_module.conn_sparse.values().detach().cpu().numpy())
    # plt.show()

    # import scvelo as scv

    # sc.pp.neighbors(ad)

    # # scv.tl.velocity_graph(ad, vkey='velocity', xkey='counts')
    # # ad.layers['velocity'] = ad.obs['dynamic_score']

    # scv.tl.velocity_graph(ad, vkey='velocity', xkey='counts')
    # ax = scv.pl.velocity_embedding_stream(ad, color='celltype', show=False) #  X_grid='X_umap', V=V)


X = ad.X.A
G @ binding_scores
np.random.shuffle(binding_scores)
False
True
ad.shape, binding_per_mode.shape
((8161, 50000), (50000, 288))
import scvelo as scv
ad.shape, binding_per_mode.shape
((8161, 50000), (50000, 288))
ad
ad.layers["velocity"] = binding_scores
# scv.tl.velocity_graph(ad, vkey='velocity', xkey='counts')
# ax = scv.pl.velocity_embedding_stream(ad, color='celltype', show=False) #  X_grid='X_umap', V=V)
np.random.shuffle(binding_scores)
binding_scores
array([[2326852.2 , 2244617.5 , 2257599.  , ..., 1032774.  , 1101569.4 ,
         961977.94],
       [2324817.8 , 2242753.2 , 2255925.8 , ..., 1032444.9 , 1101183.8 ,
         961662.06],
       [2325369.8 , 2243328.2 , 2256494.2 , ..., 1032580.2 , 1101346.9 ,
         961793.75],
       ...,
       [2327202.2 , 2244936.2 , 2257899.  , ..., 1032709.25, 1101466.1 ,
         961898.75],
       [2325772.2 , 2243165.2 , 2255936.8 , ..., 1032531.44, 1101306.5 ,
         961750.56],
       [2325220.8 , 2243139.8 , 2256282.5 , ..., 1032513.7 , 1101264.5 ,
         961729.3 ]], dtype=float32)
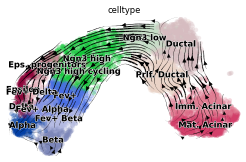
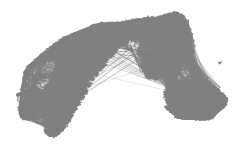
try:
    scv.pl.velocity_embedding_stream(rna_sample, color="celltype")
except Exception:
    print("sample too small.")
# np.random.shuffle(binding_scores)
# ad.layers['velocity'] = binding_scores
# scv.tl.velocity_graph(ad, vkey='velocity', xkey='counts')
# ax = scv.pl.velocity_embedding_stream(ad, color='celltype', show=False) #  X_grid='X_umap', V=V)
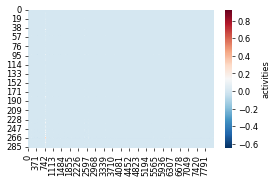
import seaborn as sns


act = model.get_log_activities().detach().cpu().squeeze(0)

sns.heatmap(act, cmap="RdBu_r", cbar_kws={"label": "activities"})
<Axes: >
scv.pl.velocity_graph(rna)
# ax = scv.pl.velocity_embedding_stream(ad,
#                                       color='celltype',
#                                       # density=2,
#                                       arrow_color='black',
#                                       n_neighbors=15) # show=False) #  X_grid='X_umap', V=V)
# ax = scv.pl.velocity_embedding_stream(ad, color='celltype', density=2, arrow_color='black', n_neighbors=15) # show=False) # X_grid='X_umap', V=V)
# scv.pl.velocity_embedding_stream(ad, color='celltype', n_neighbors=15) # X_grid='X_umap', V=V)
Study the asssociations betweeen obtained weights and cluster-specific transcription factors
Load information from archetypes DB (Vierstra et al 2020)
rna_sample, ad.shape
(AnnData object with n_obs × n_vars = 8161 × 14663
     obs: 'n_counts', 'sample', 'n_genes', 'log_genes', 'mt_frac', 'rp_frac', 'ambi_frac', 'nCount_RNA', 'nFeature_RNA', 'nCount_ATAC', 'nFeature_ATAC', 'nucleosome_signal', 'nucleosome_percentile', 'TSS.enrichment', 'TSS.percentile', 'S_score', 'G2M_score', 'phase', 'proliferation', 'celltype', 'nCount_peaks', 'nFeature_peaks', 'sample_batch', 'initial_size_unspliced', 'initial_size_spliced', 'initial_size', 'batch', 'velocity_self_transition'
     var: 'modality', 'Accession', 'Chromosome', 'End', 'Start', 'Strand', 'gene_count_corr', 'velocity_gamma', 'velocity_qreg_ratio', 'velocity_r2', 'velocity_genes'
     uns: 'celltype_colors', 'neighbors', 'velocity_graph', 'velocity_graph_neg', 'velocity_params'
     obsm: 'X_pca', 'X_pca_wsnn', 'X_spca_wsnn', 'X_umap', 'X_umap_ATAC', 'X_umap_GEX', 'X_umap_wsnn', 'lsi_full', 'lsi_red', 'umap', 'umap_ATAC', 'umap_GEX', 'velocity_umap'
     layers: 'Ms', 'Mu', 'ambiguous', 'matrix', 'spliced', 'unspliced', 'variance_velocity', 'velocity'
     obsp: 'connectivities', 'distances',
 (8161, 50000))
rna_sel = rna_sample  # rna[rna.obs_names.isin(ad.obs_names),:].copy()
rna_sel.shape
(8161, 14663)
pwd
'/mnt/c/Users/IgnacioIbarra/Dropbox/workspace/theislab/mubind/docs/notebooks/single_cell'
import bindome as bd


bd.constants.ANNOTATIONS_DIRECTORY = "annotations"
anno = mb.datasets.archetypes_anno()
rna_sel.shape
anno.sort_values("Cluster_ID")
| Cluster_ID | Name | DBD | Seed_motif | Total_width | Consensus_left | Consensus_right | Cluster_size | |
|---|---|---|---|---|---|---|---|---|
| 61 | 1 | HD/1 | homeodomain | LHX6_homeodomain_3 | 12 | 0 | 12 | 2 |
| 72 | 2 | HD/2 | homeodomain | ALX3_MA0634.1 | 26 | 8 | 16 | 186 |
| 79 | 3 | HD/3 | homeodomain | VENTX_homeodomain_2 | 21 | 3 | 20 | 1 |
| 80 | 4 | HD/4 | homeodomain | BARX1_MOUSE.H11MO.0.C | 17 | 5 | 13 | 17 |
| 81 | 5 | HD/5 | homeodomain | BARX1_homeodomain_1 | 21 | 2 | 18 | 6 |
| ... | ... | ... | ... | ... | ... | ... | ... | ... |
| 163 | 282 | PAX/2 | PAX | PAX5_HUMAN.H11MO.0.A | 24 | 4 | 21 | 3 |
| 161 | 283 | PAX-halfsite | PAX | Pax2_MA0067.1 | 8 | 1 | 7 | 1 |
| 0 | 284 | AHR | bHLH | AHR_HUMAN.H11MO.0.B | 9 | 2 | 8 | 3 |
| 105 | 285 | KLF/SP/3 | C2H2 | KLF8_HUMAN.H11MO.0.C | 9 | 0 | 9 | 2 |
| 285 | 286 | ZSCAN4 | C2H2 | ZSCAN4_C2H2_1 | 15 | 1 | 14 | 2 |
286 rows × 8 columns
for optimize_log_dynamic in model_by_logdynamic:
print(optimize_log_dynamic)
model = model_by_logdynamic[optimize_log_dynamic]
log_act = torch.stack(list(model.activities.log_activities), dim=1).squeeze(0)
log_act = pd.DataFrame(log_act.detach().cpu().numpy())
# log_act.columns = anno['Seed_motif'][2]
# log_act.columns = ['intercept', 'dinuc_bias'] + list(anno['Seed_motif'].values)
log_act.index = ad.obs_names
ad.obsm["mubind_activities"] = log_act
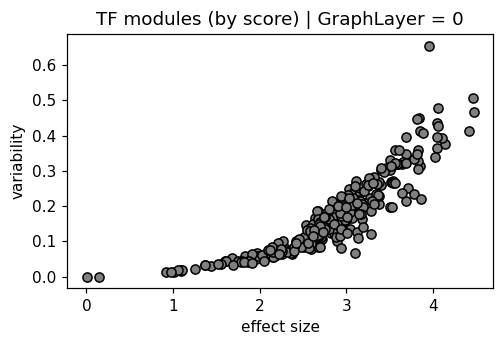
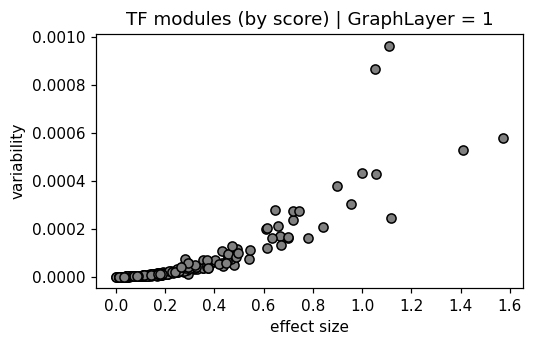
mb.pl.set_rcParams({"figure.figsize": [5, 3], "figure.dpi": 110})
delta = log_act.max(axis=0) - log_act.min(axis=0)
var = log_act.var(axis=0)
plt.scatter(delta, var, color="gray", edgecolors="black")
plt.xlabel("effect size")
plt.ylabel("variability")
plt.title("TF modules (by score) | GraphLayer = %i" % optimize_log_dynamic)
plt.show()
False
True
# unique names for annotation
names = anno["Name"]  # .sort_values('Name')
added = dict()
new_name = []
for name in names:
    if not name in added:
        new_name.append(name)
        added[name] = 0
    else:
        new_name.append(name + "_%i" % added[name])
        added[name] += 1
anno["Name_unique"] = new_name
from scipy.stats import spearmanr
res = []
for optimize_log_dynamic in model_by_logdynamic:
if not optimize_log_dynamic:
continue
model = model_by_logdynamic[optimize_log_dynamic]
log_act = torch.stack(list(model.activities.log_activities), dim=1).squeeze(0)
log_act = pd.DataFrame(log_act.detach().cpu().numpy())
# log_act.columns = anno['Seed_motif'][2]
log_act.columns = ["intercept", "dinuc_bias"] + list(range(1, 287))
log_act.index = ad.obs_names
ad.obsm["mubind_activities"] = log_act
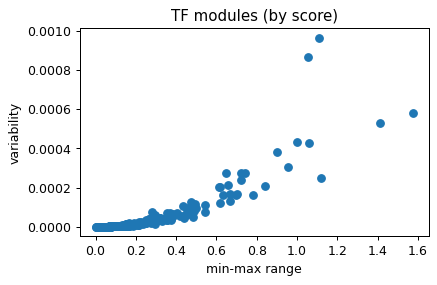
mb.pl.set_rcParams({"figure.figsize": [5, 3], "figure.dpi": 90})
delta = log_act.max(axis=0) - log_act.min(axis=0)
var = log_act.var(axis=0)
plt.scatter(delta, var)
plt.xlabel("min-max range")
plt.ylabel("variability")
plt.title("TF modules (by score)")
plt.show()
for c in log_act:
a = log_act[c]
b = ad.obs["dynamic_score"].values
# print(a.shape, b.shape)
res.append([optimize_log_dynamic, c] + list(spearmanr(a, b)))
res = pd.DataFrame(res, columns=["opt_log_dynamic", "archetype_id", "spearman", "p_val"])
# add archetypes name
meta = pd.DataFrame(pd.concat([delta, var], axis=1))
meta.columns = ["max_effect", "variability"]
meta["name"] = ["intercept", "dinuc_bias"] + list(range(1, 287))
clu = mb.datasets.archetypes_clu()
meta["archetypes_name"] = meta["name"].map(anno.set_index("Cluster_ID")["Name_unique"])
meta["archetypes_name"] = np.where(pd.isnull(meta["archetypes_name"]), meta["name"], meta["archetypes_name"])

meta["archetypes_seed"] = meta["name"].map(anno.set_index("Cluster_ID")["Seed_motif"])
meta = meta.sort_values("max_effect", ascending=0)
meta

res = res.merge(meta, left_on="archetype_id", right_on="name")
res = res.sort_values("p_val", ascending=True)
name_by_filter_id = meta["archetypes_name"].to_dict()
# name_by_filter_id
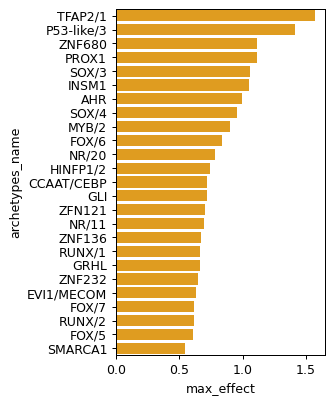
Observe general scores per binding layer filter
rcParams["figure.figsize"] = 3, 5
sns.barplot(
    data=res.sort_values("max_effect", ascending=False).head(25), x="max_effect", y="archetypes_name", color="orange"
)
<Axes: xlabel='max_effect', ylabel='archetypes_name'>
pd.options.display.width = 1000
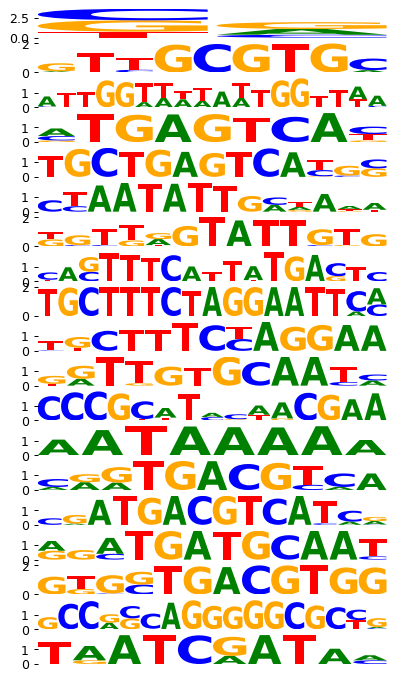
# visualize the logos as obtained by the model in each step
mb.pl.set_rcParams({"figure.figsize": [5, 20], "figure.dpi": 90})
# mb.pl.logo(model, title=False, xticks=False, rowspan_dinuc=0, rowspan_mono=1, n_rows=40, n_cols=1, stop_at=5, log_odds=False)
mb.pl.logo(model, title=False, xticks=False, rowspan_dinuc=0, rowspan_mono=1, n_rows=40, n_cols=1, stop_at=20, log_odds=True)
# n_rows=len(res.head(20).index),
break
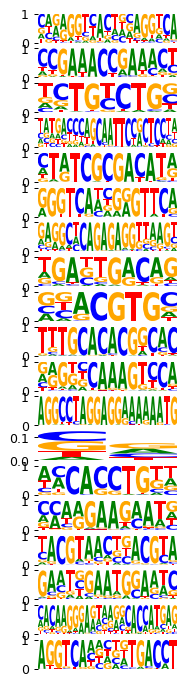
mb.pl.set_rcParams({"figure.figsize": [2, 20], "figure.dpi": 90})
mb.pl.logo(
    model,
    title=False,
    xticks=False,
    rowspan_dinuc=0,
    rowspan_mono=1,
    n_rows=40,
    # n_rows=len(res.head(20).index),
    n_cols=1,
    order=res.head(20).index,
)  # n_cols=len(reduced_groups))
plt.tight_layout()
plt.show()
<Figure size 180x1800 with 0 Axes>
import resource

print("total GB used:", resource.getrusage(resource.RUSAGE_SELF).ru_maxrss / 1e6)
total GB used: 24.692796
# for k in ad.obsm['log_activities'].iloc[:,2:]:
#     ad.obs[str(k)] = ad.obsm['log_activities'][k]
# sc.pl.umap(ad, color=map(str, ad.obsm['log_activities'].iloc[:,2:]), cmap='Reds')
rna_sel.obsm["X_umap"] = ad.obsm["X_umap"]
def find_varname(ad, k, shuffle=False):
    if not shuffle:
        return ad.var_names[ad.var_names.str.upper().str.startswith(k.upper())]
    else:
        ad_sel = ad.var_names[ad.var_names.str.upper().str.startswith(k.upper())]
        return pd.Series(ad.var_names).sample(ad_sel.shape[0]).values
from scipy.stats import spearmanr, pearsonr
Calculate global correlations between the activities obtained per motif and gene-specific expression
all_targets = set()
for optimize_log_dynamic in model_by_logdynamic:
    print(optimize_log_dynamic)
    model = model_by_logdynamic[optimize_log_dynamic]

    log_act = torch.stack(list(model.activities.log_activities), dim=1).squeeze(0)
    log_act = pd.DataFrame(log_act.detach().cpu().numpy())
    log_act.index = ad.obs_names

    ad.obsm["log_activities"] = log_act
    ad.obsm["log_activities"].columns = ["intercept", "dinuc_bias"] + list(range(1, 287))

    # collect all targets
    for k in ad.obsm["log_activities"].iloc[:, 2:]:
        log_act = ad.obsm["log_activities"][k].values
        names = set()
        clu_sel = clu[clu["Cluster_ID"] == k]["Motif"]
        for g in clu_sel:
            names.add(g.split("_")[0].split(".")[0].split("+")[0].upper())
        for g in anno[anno["Cluster_ID"] == k]["Seed_motif"]:
            names.add(g.split("_")[0].split(".")[0])
        # print(k, names)
        targets = set()
        for name in names:
            target = find_varname(rna_sel, name)
            for t in target:
                all_targets.add(t)
        if len(targets) > 0 and False:
            sc.pl.umap(rna_sel, color=targets, cmap="Reds")
False
True
def get_act_gene_corr(model_by_logdynamic, shuffle=False, random_state=0):
    print('association between motif activities and related TF targets (shuffle = %i)' % shuffle)
    res = []
    # print(len(all_targets))

    rna_sel_df = rna_sel.to_df()

    for optimize_log_dynamic in model_by_logdynamic:
        print('use GraphLayer = %i' % optimize_log_dynamic)
        model = model_by_logdynamic[optimize_log_dynamic]

        log_act = torch.stack(list(model.activities.log_activities), dim=1).squeeze(0)
        log_act = pd.DataFrame(log_act.detach().cpu().numpy())
        log_act.index = ad.obs_names

        ad.obsm['log_activities'] = log_act
        ad.obsm['log_activities'].columns = ['intercept', 'dinuc_bias'] + list(range(1, 287))

        # if shuffle:
        #     random_cols = ad.obsm['log_activities'].iloc[:,2:].columns.values
        #     np.random.shuffle(random_cols)
        #     # random_cols

        for ki, k in enumerate(ad.obsm['log_activities'].iloc[:,2:]):
            next_log_act = ad.obsm['log_activities'][k].values

            # if shuffle:
            #     next_log_act = ad.obsm['log_activities'][random_cols[ki]].values

            # print(ki)
            # if ki % 30 == 0:
            #     print(ki)
            names = set()
            clu_sel = clu[clu['Cluster_ID'] == k]['Motif']
            for g in clu_sel:
                names.add(g.split('_')[0].split('.')[0].split('+')[0].upper())
            for g in anno[anno['Cluster_ID'] == k]['Seed_motif']:
                names.add(g.split('_')[0].split('.')[0])
            # print(k, names)
            next_targets = set()
            for name in names:
                target = find_varname(rna_sel, name, shuffle=shuffle)
                # print(name, target)
                for t in target:
                    next_targets.add(t)

            # for t in all_targets:
            for t in set(all_targets).intersection(next_targets):
                gex = rna_sel_df[[t]].to_numpy() # rna_sel_df[t].A
                assert gex.shape[1] == 1
                gex = gex.flatten()
                # print(next_log_act.shape, gex.shape)
                # print(t, pearsonr(next_log_act, gex))
                res.append([ki, optimize_log_dynamic, k, t, t in next_targets] +
                        list(spearmanr(next_log_act, gex)))

    res = pd.DataFrame(res, columns=['filter_id', 'opt_log_dynamic', 'archetype_id', 'gene_name', 'matched', 'spearman', 'p_val'])

    # p-values
    res['module_name'] = res['archetype_id'].map(anno.set_index('Cluster_ID')['Name'].to_dict())
    res['p_val'] = np.where(pd.isnull(res['p_val']), 1.0, res['p_val'])

    # p-val adjust
    from statsmodels.stats.multitest import fdrcorrection
    res['p_adj'] = fdrcorrection(res['p_val'])[1]
    return res
res = get_act_gene_corr(model_by_logdynamic)
print('\nRunning permutations...')
n_perm = 10
shuffled = []
for i in range(n_perm):
    print(i)
    shuffled.append(get_act_gene_corr(model_by_logdynamic, shuffle=1, random_state=i))
# shuffled = [get_act_gene_corr(model_by_logdynamic, shuffle=1, random_state=i) for i in range(50)]
association between motif activities and related TF targets (shuffle = 0)
use GraphLayer = 0
use GraphLayer = 1

Running permutations...
0
association between motif activities and related TF targets (shuffle = 1)
use GraphLayer = 0
use GraphLayer = 1
1
association between motif activities and related TF targets (shuffle = 1)
use GraphLayer = 0
use GraphLayer = 1
2
association between motif activities and related TF targets (shuffle = 1)
use GraphLayer = 0
use GraphLayer = 1
3
association between motif activities and related TF targets (shuffle = 1)
use GraphLayer = 0
use GraphLayer = 1
4
association between motif activities and related TF targets (shuffle = 1)
use GraphLayer = 0
use GraphLayer = 1
5
association between motif activities and related TF targets (shuffle = 1)
use GraphLayer = 0
use GraphLayer = 1
6
association between motif activities and related TF targets (shuffle = 1)
use GraphLayer = 0
use GraphLayer = 1
7
association between motif activities and related TF targets (shuffle = 1)
use GraphLayer = 0
use GraphLayer = 1
8
association between motif activities and related TF targets (shuffle = 1)
use GraphLayer = 0
use GraphLayer = 1
9
association between motif activities and related TF targets (shuffle = 1)
use GraphLayer = 0
use GraphLayer = 1
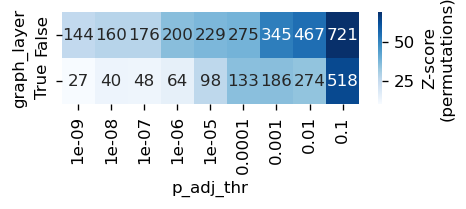
table = []
for use_graph in [False, True]:
    for thr in range(1, 10):
        sel = res[res['opt_log_dynamic'] == use_graph]
        next_thr = 10 ** (-thr)
        n_pos = sel[sel['p_adj'] < next_thr].shape[0]
        n_neg = [s[(s['p_adj'] < next_thr) & (s['opt_log_dynamic'] == use_graph)].shape[0] for s in shuffled]
        # print(next_thr, n_pos, np.mean(n_neg), np.std(n_neg), (n_pos - np.mean(n_neg)) / np.std(n_neg))
        table.append([next_thr, n_pos, np.mean(n_neg), np.std(n_neg), (n_pos - np.mean(n_neg)) / np.std(n_neg), use_graph])
table = pd.DataFrame(table, columns=['p_adj_thr', 'n_pos', 'mu', 'sigma', 'zscore', 'graph_layer'])
table.pivot(index='graph_layer', columns='p_adj_thr', values='zscore')
| p_adj_thr | 1.000000e-09 | 1.000000e-08 | 1.000000e-07 | 1.000000e-06 | 1.000000e-05 | 1.000000e-04 | 1.000000e-03 | 1.000000e-02 | 1.000000e-01 |
|---|---|---|---|---|---|---|---|---|---|
| graph_layer | |||||||||
| False | 25.955710 | 27.872501 | 27.910294 | 35.532982 | 37.300271 | 38.454778 | 51.310414 | 54.805231 | 68.835313 |
| True | 10.512276 | 13.535528 | 13.312500 | 15.649224 | 26.665466 | 35.235294 | 35.433265 | 33.995949 | 63.204079 |
rcParams['figure.figsize'] = 4, 1
rcParams['figure.dpi'] = 120
rcParams['pdf.fonttype'] = 42
hm = table.pivot(index='graph_layer', columns='p_adj_thr', values='n_pos').fillna(0)
z = table.pivot(index='graph_layer', columns='p_adj_thr', values='zscore').fillna(0)
sns.heatmap(z, annot=hm, fmt='', cmap='Blues', # vmin=0, vmax=5,
            cbar_kws={'label': 'Z-score\n(permutations)'})

plt.savefig('../../../output/zscore_filter_act_gex_cor_pancreatic_endocrinogesis.pdf')
plt.show()
genes_by_module_name = (
    res.groupby(["module_name"])["gene_name"].apply(lambda grp: list(grp.value_counts().index)).to_dict()

)
# genes_by_module_name
res.sort_values("p_adj")
| filter_id | opt_log_dynamic | archetype_id | gene_name | matched | spearman | p_val | module_name | p_adj | |
|---|---|---|---|---|---|---|---|---|---|
| 277 | 68 | False | 69 | Meis2 | True | 0.253829 | 3.531138e-120 | MIES | 1.363019e-116 |
| 1711 | 245 | False | 246 | Rfx6 | True | -0.246340 | 4.372267e-113 | RFX/3 | 8.438475e-110 |
| 1588 | 150 | False | 151 | Rest | True | 0.237454 | 5.574720e-105 | REST/NRSF | 7.172807e-102 |
| 1377 | 81 | False | 82 | Pou3f4 | True | 0.227013 | 7.048015e-96 | POU/2 | 6.801334e-93 |
| 1436 | 95 | False | 96 | Ehf | True | 0.219672 | 9.477964e-90 | ETS/2 | 7.316988e-87 |
| ... | ... | ... | ... | ... | ... | ... | ... | ... | ... |
| 3449 | 108 | True | 109 | Egr1 | True | 0.000016 | 9.988476e-01 | KLF/SP/2 | 9.996254e-01 |
| 2723 | 69 | True | 70 | Thumpd1 | True | -0.000016 | 9.988485e-01 | TBX/1 | 9.996254e-01 |
| 1152 | 69 | False | 70 | Tnfrsf22 | True | 0.000005 | 9.996116e-01 | TBX/1 | 9.998707e-01 |
| 2930 | 69 | True | 70 | Tpd52l1 | True | 0.000008 | 9.993975e-01 | TBX/1 | 9.998707e-01 |
| 1406 | 91 | False | 92 | Sox11 | True | -0.000002 | 9.998756e-01 | SOX/3 | 9.998756e-01 |
3860 rows × 9 columns
res["k"] = res["gene_name"] + "_" + res["archetype_id"].astype(str)
df2 = res.pivot(index="k", columns="opt_log_dynamic", values="spearman")
# df2 = res # .pivot(index='k', columns='opt_log_dynamic', values='spearman')
df2
| opt_log_dynamic | False | True |
|---|---|---|
| k | ||
| Ahr_284 | 0.041996 | 0.023966 |
| Aire_139 | 0.008289 | 0.021390 |
| Ap2a1_264 | -0.028934 | -0.017731 |
| Ap2a2_264 | -0.020486 | 0.005195 |
| Ap2b1_264 | -0.050461 | -0.016013 |
| ... | ... | ... |
| Zfp820_121 | 0.020229 | 0.011756 |
| Zfp821_121 | 0.001718 | -0.016109 |
| Zfp825_121 | 0.018146 | 0.009312 |
| Zfp827_121 | -0.031124 | -0.014224 |
| Zfx_144 | 0.027819 | 0.030549 |
1930 rows × 2 columns
mb.pl.set_rcParams({"figure.figsize": [5, 4], "figure.dpi": 120})
# df2 = df2.sort_values('matched', ascending=True)
# plt.scatter(df2[True], df2[True],
#             color=np.where(df2['matched'], 'blue', 'gray'),
#             s=np.where(df2['matched'], 30, 5))
# plt.xlabel('TF activity (graph = off)')
# plt.ylabel('TF activity (graph = on)')
# plt.axhline(0, color='gray', ls='--', zorder=0)
# plt.axvline(0, color='gray', ls='--', zorder=0)
# df2[df2['matched'] == True].sort_values(True, ascending=False)
# res['arch_name'] = name_by_filter_id
res
| filter_id | opt_log_dynamic | archetype_id | gene_name | matched | spearman | p_val | module_name | p_adj | k | |
|---|---|---|---|---|---|---|---|---|---|---|
| 0 | 1 | False | 2 | Pou6f1 | True | -0.012835 | 2.463036e-01 | HD/2 | 4.397465e-01 | Pou6f1_2 |
| 1 | 1 | False | 2 | Pou6f2 | True | -0.004708 | 6.706317e-01 | HD/2 | 8.131867e-01 | Pou6f2_2 |
| 2 | 1 | False | 2 | Nkx6-1 | True | 0.019021 | 8.575862e-02 | HD/2 | 2.067634e-01 | Nkx6-1_2 |
| 3 | 1 | False | 2 | Dlx1as | True | -0.011318 | 3.066163e-01 | HD/2 | 5.133309e-01 | Dlx1as_2 |
| 4 | 1 | False | 2 | Lmx1b | True | -0.011210 | 3.112775e-01 | HD/2 | 5.183482e-01 | Lmx1b_2 |
| ... | ... | ... | ... | ... | ... | ... | ... | ... | ... | ... |
| 3855 | 280 | True | 281 | Pax6 | True | -0.080454 | 3.368429e-13 | PAX/1 | 9.490611e-12 | Pax6_281 |
| 3856 | 280 | True | 281 | Pax6os1 | True | -0.041961 | 1.495984e-04 | PAX/1 | 1.075326e-03 | Pax6os1_281 |
| 3857 | 282 | True | 283 | Pax2 | True | -0.003662 | 7.408379e-01 | PAX-halfsite | 8.568437e-01 | Pax2_283 |
| 3858 | 283 | True | 284 | Ahr | True | 0.023966 | 3.038693e-02 | AHR | 9.556552e-02 | Ahr_284 |
| 3859 | 284 | True | 285 | Klf8 | True | -0.019348 | 8.050853e-02 | KLF/SP/3 | 1.976863e-01 | Klf8_285 |
3860 rows × 10 columns
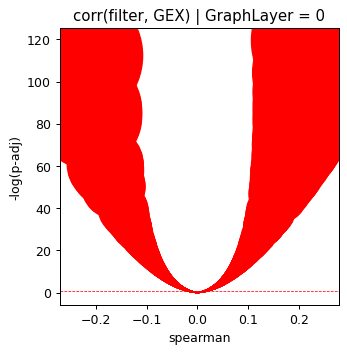
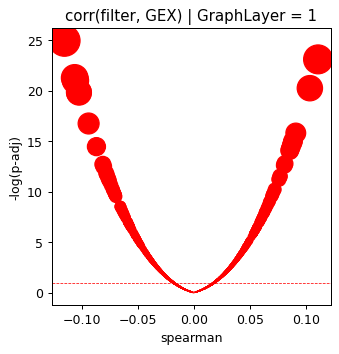
rcParams["figure.figsize"] = 4, 4
rcParams["figure.dpi"] = 90

for optimize_log_dynamic, grp in res.groupby("opt_log_dynamic"):
    grp["minus_log10_pval"] = -np.log10(grp["p_val"])
    grp = grp.sort_values("matched")
    plt.scatter(
        grp["spearman"],
        grp["minus_log10_pval"],
        s=np.power(grp["minus_log10_pval"], 2),
        color=np.where(grp["matched"], "red", "blue"),
    )
    plt.ylabel("-log(p-adj)")
    plt.xlabel("spearman")
    plt.title("corr(filter, GEX) | GraphLayer = %i" % optimize_log_dynamic)
    plt.axhline(1, ls="--", color="red", lw=0.6)
    plt.show()
# sc.pl.umap(ad, color=[96], cmap='RdBu_r')
# sc.pl.umap(rna_sel, color=['Ehf', 'Ergic2'], cmap='plasma')
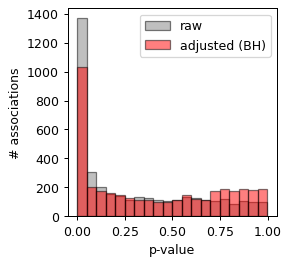
rcParams["figure.figsize"] = 3, 3
rcParams["figure.dpi"] = 90
plt.hist(res["p_val"], color="gray", bins=20, label="raw", alpha=0.5, edgecolor="black")
plt.hist(res["p_adj"], color="red", bins=20, label="adjusted (BH)", alpha=0.5, edgecolor="black")
plt.xlabel("p-value")
plt.legend()
plt.ylabel("# associations")
Text(0, 0.5, '# associations')
res[res["p_adj"] < 0.05]
| filter_id | opt_log_dynamic | archetype_id | gene_name | matched | spearman | p_val | module_name | p_adj | k | |
|---|---|---|---|---|---|---|---|---|---|---|
| 9 | 1 | False | 2 | Pdx1 | True | 0.032841 | 3.006220e-03 | HD/2 | 1.455961e-02 | Pdx1_2 |
| 11 | 1 | False | 2 | Pax4 | True | -0.033665 | 2.353099e-03 | HD/2 | 1.184219e-02 | Pax4_2 |
| 18 | 7 | False | 8 | Arx | True | -0.081863 | 1.295229e-13 | HD/8 | 3.845833e-12 | Arx_8 |
| 19 | 7 | False | 8 | Arxes2 | True | 0.034815 | 1.657269e-03 | HD/8 | 8.787167e-03 | Arxes2_8 |
| 20 | 9 | False | 10 | Hnf1aos1 | True | 0.035551 | 1.317555e-03 | HD/10 | 7.163043e-03 | Hnf1aos1_10 |
| ... | ... | ... | ... | ... | ... | ... | ... | ... | ... | ... |
| 3842 | 262 | True | 263 | Tfap2c | True | 0.027537 | 1.285757e-02 | TFAP2/2 | 4.823149e-02 | Tfap2c_263 |
| 3847 | 264 | True | 265 | Ctcf | True | 0.046348 | 2.806301e-05 | CTCF | 2.391241e-04 | Ctcf_265 |
| 3849 | 267 | True | 268 | Plag1 | True | -0.028093 | 1.115049e-02 | PLAG1 | 4.317042e-02 | Plag1_268 |
| 3855 | 280 | True | 281 | Pax6 | True | -0.080454 | 3.368429e-13 | PAX/1 | 9.490611e-12 | Pax6_281 |
| 3856 | 280 | True | 281 | Pax6os1 | True | -0.041961 | 1.495984e-04 | PAX/1 | 1.075326e-03 | Pax6os1_281 |
1033 rows × 10 columns
pval_thr = 1e-5
sel_genes = set(list(res[res["p_adj"] < pval_thr]["gene_name"]))
log_act = ad.obsm["log_activities"].copy()
log_act.shape
(8161, 288)
cols_act = ["intercept", "dinuc_bias"] + [name_by_filter_id[k] for k in log_act.columns[2:]]
log_act.columns = cols_act
log_act
| intercept | dinuc_bias | HD/1 | HD/2 | HD/3 | HD/4 | HD/5 | HD/6 | HD/7 | HD/8 | ... | GMEB2/2 | GMEB2/3 | FOX/9 | SIX/2 | PAX/1 | PAX/2 | PAX-halfsite | AHR | KLF/SP/3 | ZSCAN4 | |
|---|---|---|---|---|---|---|---|---|---|---|---|---|---|---|---|---|---|---|---|---|---|
| AAACAGCCAACAGCCT-1-0 | 3.806271e-08 | 0.000003 | 7.695544e-05 | 0.000185 | 0.000027 | 0.000018 | 0.000150 | 0.000090 | 0.000008 | 0.000290 | ... | 0.000683 | 0.000745 | 0.000040 | -0.000298 | 0.000297 | 0.000039 | 0.000093 | 0.002540 | -0.000023 | 0.000095 |
| AAACAGCCAACCCTCC-1-0 | -1.162185e-07 | -0.000003 | 4.249436e-07 | -0.001115 | -0.000109 | -0.000263 | -0.000553 | -0.000185 | -0.001000 | -0.002746 | ... | -0.000548 | -0.005312 | -0.000712 | -0.001427 | -0.005037 | -0.000265 | -0.002616 | -0.003395 | -0.000373 | -0.000473 |
| AAACAGCCACTAAGCC-1-0 | 1.481323e-06 | -0.000031 | 4.224365e-04 | 0.061922 | 0.004885 | 0.001461 | 0.002665 | 0.008734 | 0.030506 | -0.058731 | ... | -0.048243 | 0.090099 | 0.075321 | 0.071688 | 0.167776 | 0.009557 | 0.061679 | -0.104413 | 0.061235 | -0.030773 |
| AAACAGCCAGGATAAC-1-0 | -2.535439e-08 | -0.000002 | -6.218390e-06 | -0.000374 | -0.000033 | -0.000034 | -0.000129 | -0.000039 | -0.000187 | -0.000504 | ... | -0.000163 | -0.000923 | -0.000504 | -0.000577 | -0.000655 | -0.000044 | -0.000708 | -0.002082 | 0.000082 | -0.000144 |
| AAACAGCCATAAAGCA-1-0 | 1.866635e-07 | 0.000009 | 1.157708e-04 | 0.001055 | 0.000114 | 0.000441 | 0.000247 | 0.000247 | 0.000514 | 0.003035 | ... | 0.002118 | 0.002020 | 0.003678 | 0.002987 | 0.003853 | 0.000299 | 0.001518 | 0.003987 | 0.001712 | 0.000473 |
| ... | ... | ... | ... | ... | ... | ... | ... | ... | ... | ... | ... | ... | ... | ... | ... | ... | ... | ... | ... | ... | ... |
| TTTGTGTTCACGAATC-1-1 | -3.571261e-08 | -0.000003 | -2.040713e-05 | -0.000369 | -0.000042 | -0.000082 | -0.000164 | -0.000066 | -0.000259 | -0.000607 | ... | -0.000259 | -0.001202 | -0.000679 | -0.000618 | -0.000922 | -0.000043 | -0.000762 | -0.001915 | -0.000268 | -0.000198 |
| TTTGTGTTCGAGCTAT-1-1 | -3.510256e-08 | -0.000002 | 2.103153e-05 | -0.000582 | -0.000046 | -0.000057 | -0.000249 | -0.000077 | -0.000564 | -0.001008 | ... | -0.000085 | -0.001882 | -0.000534 | -0.001164 | -0.000909 | -0.000017 | -0.001656 | -0.002895 | -0.000303 | -0.000225 |
| TTTGTGTTCTCAATGA-1-1 | -4.718245e-08 | -0.000003 | -3.709015e-05 | -0.000300 | -0.000047 | -0.000153 | -0.000134 | -0.000069 | -0.000327 | -0.000638 | ... | -0.000368 | -0.001265 | -0.000826 | -0.000719 | -0.001065 | -0.000046 | -0.000662 | -0.001764 | -0.000471 | -0.000174 |
| TTTGTTGGTATTGAGT-1-1 | -3.771812e-08 | -0.000003 | -1.994044e-05 | -0.000378 | -0.000042 | -0.000116 | -0.000139 | -0.000064 | -0.000266 | -0.000597 | ... | -0.000290 | -0.001464 | -0.000433 | -0.000576 | -0.000906 | -0.000041 | -0.000935 | -0.001973 | -0.000344 | -0.000205 |
| TTTGTTGGTTGTTGCT-1-1 | -4.738262e-08 | -0.000003 | -3.046263e-05 | -0.000377 | -0.000069 | -0.000157 | -0.000204 | -0.000086 | -0.000439 | -0.001027 | ... | -0.000442 | -0.001635 | -0.000916 | -0.000986 | -0.000826 | -0.000029 | -0.001108 | -0.002171 | -0.000469 | -0.000263 |
8161 rows × 288 columns
import anndata


ad_act = anndata.AnnData(log_act)

ad_act.obsm["X_umap"] = ad.obsm["X_umap"]

ad_act.obs = ad.obs
sc.pl.umap(ad_act, color="celltype")
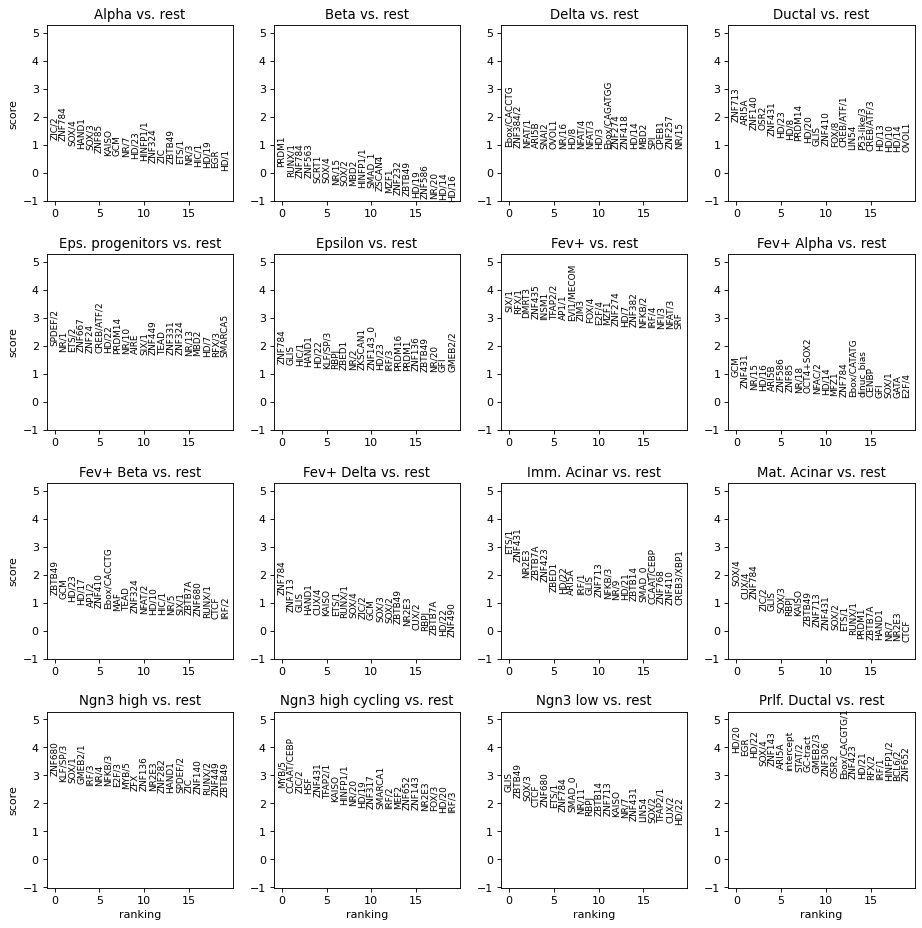
Rank genes groups using the annotation
sc.tl.rank_genes_groups(ad_act, "celltype")
rkg_df = []
for ct in ad_act.obs["celltype"].values.unique():
    print(ct)
    rkg_df2 = sc.get.rank_genes_groups_df(ad_act, ct)
    rkg_df2["celltype"] = ct
    rkg_df.append(rkg_df2)
rkg_df = pd.concat(rkg_df)
rkg_df["module_name"] = rkg_df["names"].map(anno.set_index("Cluster_ID")["Name"].to_dict())
rkg_df["module_name"] = np.where(~pd.isnull(rkg_df["module_name"]), rkg_df["module_name"], rkg_df["names"])
rkg_df.head()
Fev+ Alpha
Fev+
Ngn3 high
Eps. progenitors
Ngn3 low
Fev+ Beta
Ductal
Fev+ Delta
Imm. Acinar
Alpha
Prlf. Ductal
Epsilon
Ngn3 high cycling
Beta
Delta
Mat. Acinar
| names | scores | logfoldchanges | pvals | pvals_adj | celltype | module_name | |
|---|---|---|---|---|---|---|---|
| 0 | GCM | 0.910906 | 3.654080 | 0.362733 | 0.627158 | Fev+ Alpha | GCM |
| 1 | ZNF431 | 0.515329 | 4.179523 | 0.606397 | 0.835609 | Fev+ Alpha | ZNF431 |
| 2 | NR/15 | 0.422957 | NaN | 0.672541 | 0.905102 | Fev+ Alpha | NR/15 |
| 3 | HD/16 | 0.403896 | NaN | 0.686494 | 0.916561 | Fev+ Alpha | HD/16 |
| 4 | ARI5B | 0.402635 | NaN | 0.687421 | 0.916561 | Fev+ Alpha | ARI5B |
Get top modules
ad_act.var_names = ad_act.var_names.map(rkg_df.set_index("names")["module_name"].to_dict())
sc.tl.rank_genes_groups(ad_act, "celltype")
rcParams["figure.figsize"] = 3.5, 3.5
rcParams["figure.dpi"] = 80
sc.pl.rank_genes_groups(ad_act)
set(res[(res["p_adj"] < 1e-5)]["k"])
{'Araf_248',
 'Arc_248',
 'Arcn1_248',
 'Arel1_248',
 'Arf3_248',
 'Arf5_248',
 'Arf6_248',
 'Arfgap1_248',
 'Arfgap3_248',
 'Arfgef1_248',
 'Arfgef2_248',
 'Arfgef3_248',
 'Arhgap10_248',
 'Arhgap11a_248',
 'Arhgap18_248',
 'Arhgap19_248',
 'Arhgap21_248',
 'Arhgap24_248',
 'Arhgap26_248',
 'Arhgap28_248',
 'Arhgap32_248',
 'Arhgap35_248',
 'Arhgap36_248',
 'Arhgap42_248',
 'Arhgap5_248',
 'Arhgap6_248',
 'Arhgdig_248',
 'Arhgef11_248',
 'Arhgef12_248',
 'Arhgef19_248',
 'Arhgef26_248',
 'Arhgef38_248',
 'Arhgef39_248',
 'Arhgef40_248',
 'Arhgef5_248',
 'Arhgef6_248',
 'Arhgef7_248',
 'Arhgef9_248',
 'Arid1b_248',
 'Arid2_248',
 'Arid3b_248',
 'Arid4b_248',
 'Arih1_248',
 'Arih2_248',
 'Arl13b_248',
 'Arl15_248',
 'Arl3_248',
 'Arl4a_248',
 'Arl4c_248',
 'Arl6ip1_248',
 'Arl6ip4_248',
 'Arl8a_248',
 'Armc4_248',
 'Armc8_248',
 'Armc9_248',
 'Armh3_248',
 'Arnt_248',
 'Arpc1a_248',
 'Arpc1b_248',
 'Arpc2_248',
 'Arpc5_248',
 'Arpc5l_248',
 'Arpp19_248',
 'Arrdc4_248',
 'Arsa_248',
 'Arx_248',
 'Arx_8',
 'Bhlha15_62',
 'Cebpa_52',
 'Cebpb_52',
 'Cebpd_52',
 'Ctcf_265',
 'Cux1_14',
 'Dbpht2_52',
 'Ebf1_174',
 'Ehf_96',
 'Ehf_98',
 'Elf5_96',
 'Elf5_98',
 'Erf_98',
 'Erg28_96',
 'Erg28_98',
 'Ergic2_96',
 'Ets1_96',
 'Ets1_98',
 'Etv1_98',
 'Etv6_96',
 'Etv6_98',
 'Fev_96',
 'Fev_98',
 'Foxo1_164',
 'Foxo1_77',
 'Foxo1_79',
 'Foxo1_80',
 'Foxo6_80',
 'Foxp1_79',
 'Gata4_242',
 'Gli3_262',
 'Glis3_261',
 'Hes1_59',
 'Id2_58',
 'Insm1_266',
 'Irf2_104',
 'Irf2_106',
 'Irf2bp2_104',
 'Irf2bp2_106',
 'Irf2bpl_104',
 'Irf2bpl_106',
 'Isl1_2',
 'Jun_49',
 'Jund_50',
 'Klf12_109',
 'Klf15_113',
 'Klf6_109',
 'Lin54_224',
 'Mafa_55',
 'Mafb_50',
 'Mafb_53',
 'Mafb_55',
 'Mafg_53',
 'Mafg_55',
 'Mecom_241',
 'Meis1_69',
 'Meis2_69',
 'Meis3_69',
 'Mga_73',
 'Mlxipl_58',
 'Mxi1_59',
 'Myb_252',
 'Mybbp1a_252',
 'Mybl1_252',
 'Mybl1_255',
 'Mybl1_256',
 'Mybl2_252',
 'Mybl2_255',
 'Myc_59',
 'Mycbp2_59',
 'Mycn_59',
 'Neurod1_63',
 'Nfatc2_100',
 'Nfia_188',
 'Nfia_189',
 'Nfib_189',
 'Nfil3_52',
 'Nr2c2_30',
 'Nr5a2_40',
 'Nr6a1_40',
 'Onecut1_14',
 'Pax6_281',
 'Pax6os1_281',
 'Pbx1_12',
 'Pdx1_21',
 'Pou3f1_82',
 'Pou3f4_82',
 'Pou3f4_85',
 'Ppargc1b_32',
 'Prdm16_105',
 'Ptf1a_63',
 'Rara_40',
 'Rbpjl_165',
 'Relch_159',
 'Rell1_159',
 'Rest_151',
 'Rfx2_245',
 'Rfx2_247',
 'Rfx3_245',
 'Rfx3_247',
 'Rfx6_246',
 'Rora_32',
 'Rora_42',
 'Rora_48',
 'Runx1t1_179',
 'Rxra_33',
 'Rxra_44',
 'Rxrg_30',
 'Rxrg_33',
 'Rxrg_40',
 'Six4_180',
 'Sox4_89',
 'Sox5_91',
 'Sox6_89',
 'Sox9_190',
 'Sox9_191',
 'Sox9_202',
 'Sox9_89',
 'Sox9_92',
 'Sox9_93',
 'Sox9_94',
 'Stat3_171',
 'Tacc3_70',
 'Taf13_113',
 'Taf1d_113',
 'Taf1d_70',
 'Tagln2_70',
 'Tbc1d1_70',
 'Tbc1d31_70',
 'Tbc1d8_70',
 'Tbc1d9_70',
 'Tcf7l1_29',
 'Tcf7l1_70',
 'Tcf7l2_120',
 'Tcf7l2_29',
 'Tcf7l2_70',
 'Tdrd7_70',
 'Tead2_166',
 'Tead2_70',
 'Tecpr1_70',
 'Tenm3_70',
 'Tent5a_70',
 'Tgif1_69',
 'Tgif2_69',
 'Tgm2_70',
 'Thra_34',
 'Thsd4_70',
 'Tiam1_70',
 'Ticrr_70',
 'Tinagl1_70',
 'Tjp1_70',
 'Tk1_70',
 'Tlnrd1_70',
 'Tmcc3_70',
 'Tmed10_70',
 'Tmem108_70',
 'Tmem163_70',
 'Tmem164_70',
 'Tmem176b_70',
 'Tmem178b_70',
 'Tmem181a_70',
 'Tmem184a_70',
 'Tmem200a_70',
 'Tmod2_70',
 'Tmpo_70',
 'Tmsb10_70',
 'Tmsb15b2_70',
 'Tmsb4x_70',
 'Tmtc2_70',
 'Tmx1_70',
 'Tnik_70',
 'Tnr_70',
 'Tob1_70',
 'Top2a_70',
 'Topbp1_70',
 'Tox3_70',
 'Tpcn1_70',
 'Tpm3_70',
 'Tpr_70',
 'Tpst2_70',
 'Tpt1_70',
 'Tpx2_70',
 'Trim28_70',
 'Trim35_70',
 'Trim37_70',
 'Trim59_70',
 'Trim9_70',
 'Trip13_70',
 'Trp53_70',
 'Trp53i11_70',
 'Trp73_70',
 'Trpc1_70',
 'Trpm3_70',
 'Try10_70',
 'Try5_70',
 'Tshz1_70',
 'Tshz2_70',
 'Tshz3_70',
 'Tspan7_70',
 'Tspear_70',
 'Ttc28_70',
 'Ttf2_70',
 'Ttk_70',
 'Ttr_70',
 'Ttyh1_70',
 'Ttyh2_70',
 'Ttyh3_70',
 'Tuba1a_70',
 'Tuba1b_70',
 'Tubb2a_70',
 'Tubb3_70',
 'Tubb5_70',
 'Tuft1_70',
 'Tusc3_70',
 'Tut4_70',
 'Tyms_70',
 'Vdr_44',
 'Zbtb7c_262',
 'Zeb1_67',
 'Zeb1_68'}
res[res["module_name"].str.contains("HD")].sort_values("p_adj")
| filter_id | opt_log_dynamic | archetype_id | gene_name | matched | spearman | p_val | module_name | p_adj | k | |
|---|---|---|---|---|---|---|---|---|---|---|
| 42 | 20 | False | 21 | Pdx1 | True | 0.085723 | 8.687087e-15 | HD/16 | 2.865996e-13 | Pdx1_21 |
| 18 | 7 | False | 8 | Arx | True | -0.081863 | 1.295229e-13 | HD/8 | 3.845833e-12 | Arx_8 |
| 1946 | 1 | True | 2 | Isl1 | True | -0.075389 | 9.154130e-12 | HD/2 | 2.222323e-10 | Isl1_2 |
| 25 | 11 | False | 12 | Pbx1 | True | 0.065727 | 2.795715e-09 | HD/12 | 5.042739e-08 | Pbx1_12 |
| 1971 | 18 | True | 19 | Meis1 | True | 0.053219 | 1.506326e-06 | HD/14 | 1.680467e-05 | Meis1_19 |
| ... | ... | ... | ... | ... | ... | ... | ... | ... | ... | ... |
| 1973 | 20 | True | 21 | Pbx2 | True | -0.002056 | 8.526826e-01 | HD/16 | 9.218578e-01 | Pbx2_21 |
| 1933 | 1 | True | 2 | Dlx1as | True | -0.001950 | 8.602075e-01 | HD/2 | 9.268220e-01 | Dlx1as_2 |
| 46 | 23 | False | 24 | Arid3a | True | -0.001547 | 8.888475e-01 | HD/18 | 9.415344e-01 | Arid3a_24 |
| 12 | 1 | False | 2 | Arid3b | True | 0.000642 | 9.537659e-01 | HD/2 | 9.767940e-01 | Arid3b_2 |
| 7 | 1 | False | 2 | Mnx1 | True | -0.000469 | 9.662018e-01 | HD/2 | 9.827507e-01 | Mnx1_2 |
68 rows × 10 columns
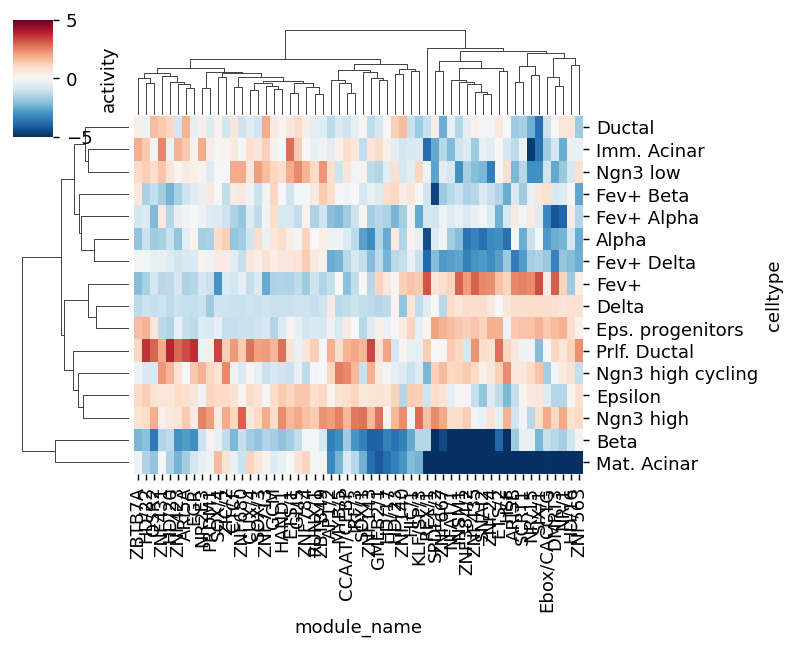
mod_names_best = set(rkg_df.sort_values("scores", ascending=False).groupby("celltype").head(5)["module_name"])
best = rkg_df[rkg_df["module_name"].isin(mod_names_best)]
rcParams["figure.dpi"] = 130
sns.clustermap(
    best.pivot(index="celltype", columns="module_name", values="scores"),
    cbar_kws={"label": "activity"},
    cmap="RdBu_r",
    vmin=-5,
    vmax=5,
    figsize=[6.2, 5],
    # dpi=100,
    xticklabels=True,
)
<seaborn.matrix.ClusterGrid at 0x7fc897a76e20>
rna_tfs = rna_sel.to_df()[list(set(res["gene_name"]))]
rna_tfs["celltype"] = rna_sel.obs["celltype"]
mean_tfs = rna_tfs.groupby("celltype").mean()

act_tfs_df = ad_act.to_df()
act_tfs_df["celltype"] = ad_act.obs["celltype"]
mean_act_tf = act_tfs_df.groupby("celltype").mean()
corr_celltype = []
for i, c1 in enumerate(mean_act_tf):
    if i % 50 == 0:
        print(i, mean_act_tf.shape[1])
    for j, c2 in enumerate(mean_tfs):
        if not c1 in genes_by_module_name or not c2 in genes_by_module_name[c1]:
            continue
        a = mean_act_tf[c1]
        b = mean_tfs[c2]
        corr_celltype.append([c1, c2, mean_act_tf.index[np.argmax(mean_act_tf[c1])]] + list(pearsonr(a, b)))

corr = pd.DataFrame(corr_celltype, columns=["module_name", "gene_name", "cell_type", "pearsonr", "p_val"])
corr = corr.sort_values("pearsonr", ascending=False)
0 288
50 288
100 288
150 288
200 288
250 288
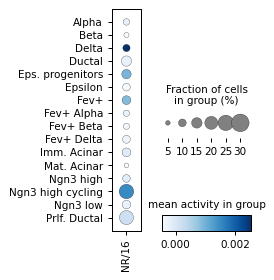
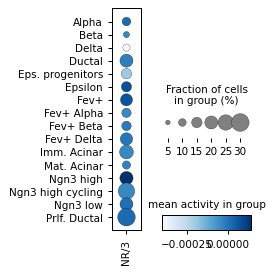
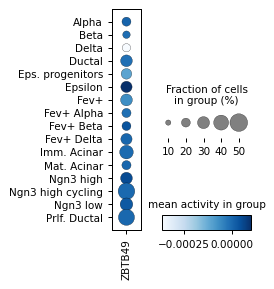
rcParams['figure.dpi'] = 150
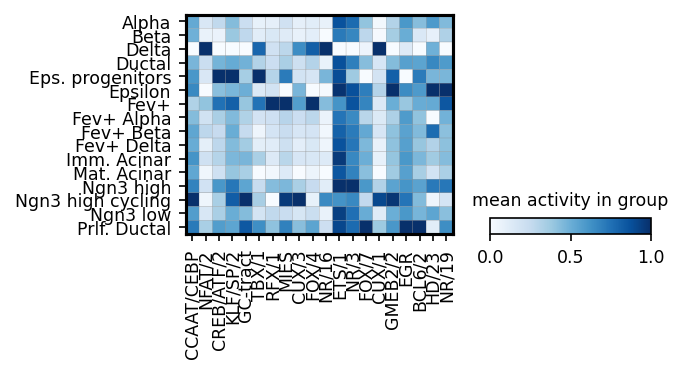
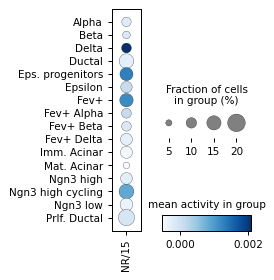
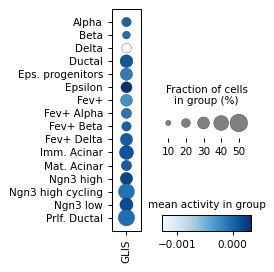
# activators
module_names = corr[corr['pearsonr'] > 0].sort_values('p_val').sort_values('p_val').groupby('cell_type').head(3)['module_name'].drop_duplicates()
gene_names = corr[corr['pearsonr'] > 0].sort_values('p_val').sort_values('p_val').groupby('cell_type').head(3)['gene_name']
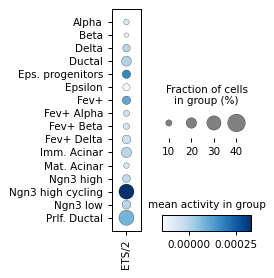
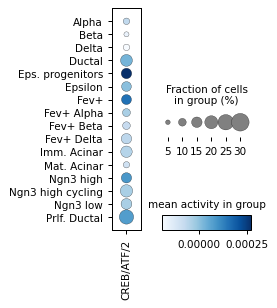
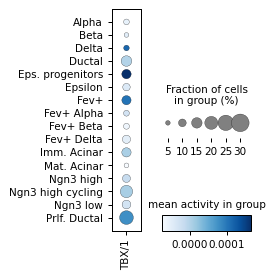
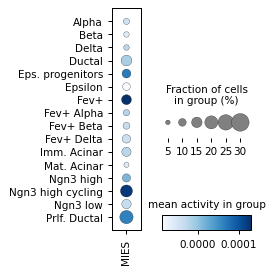
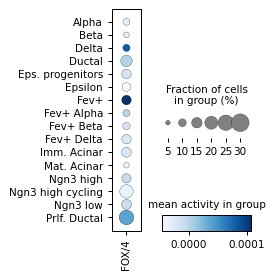
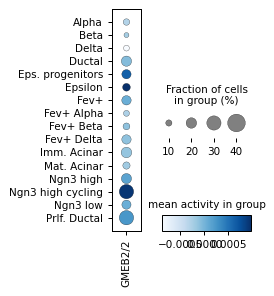
sc.pl.matrixplot(ad_act,
groupby=cell_type_key,
cmap='Blues',
show=False,
var_names=module_names,
figsize=[4, 1.9],
standard_scale='var',
colorbar_title='mean activity in group')
plt.savefig('../../../output/filter_activities_pancreatic_endocrinogenesis.pdf')
plt.show()
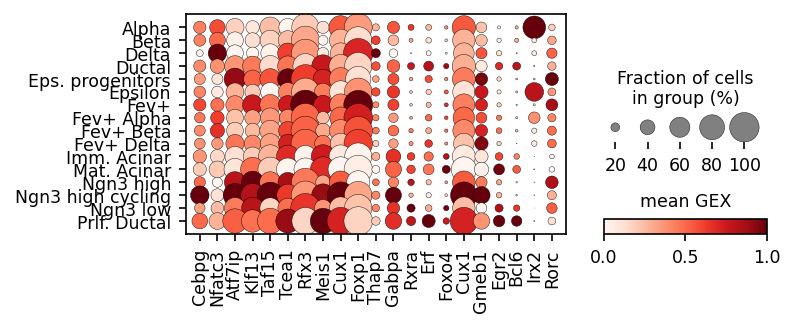
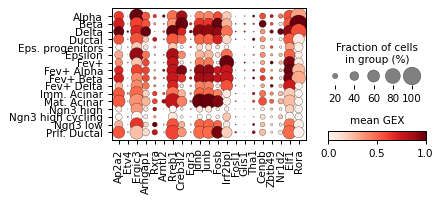
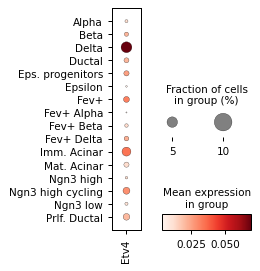
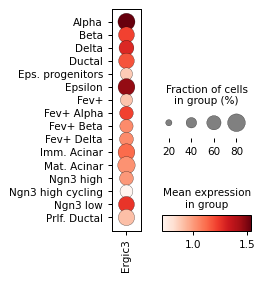
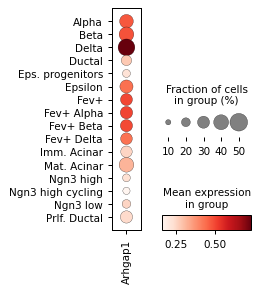
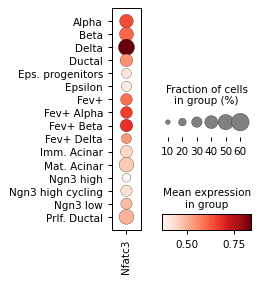
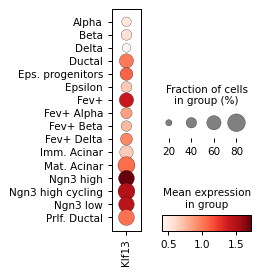
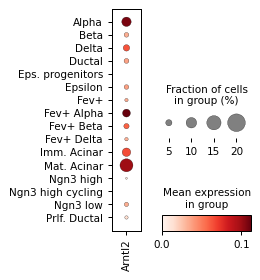
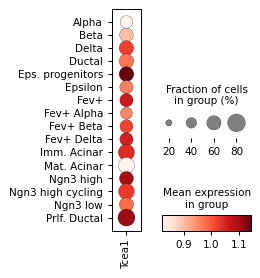
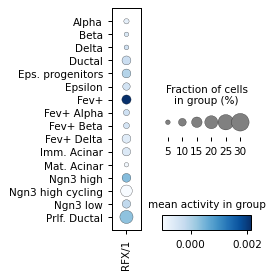
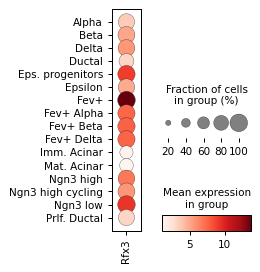
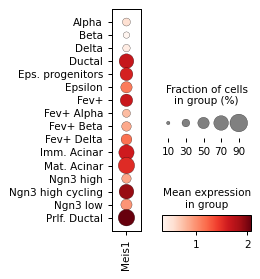
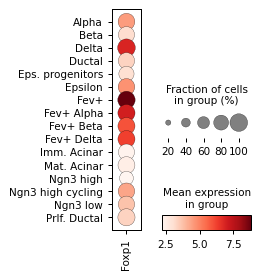
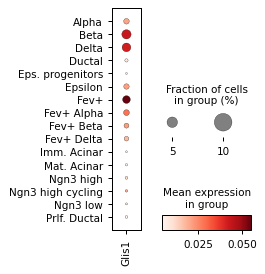
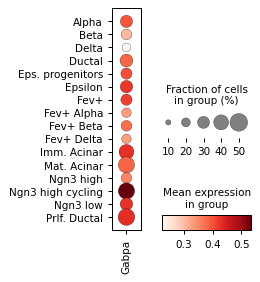
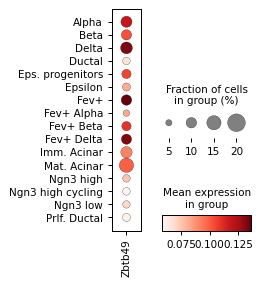
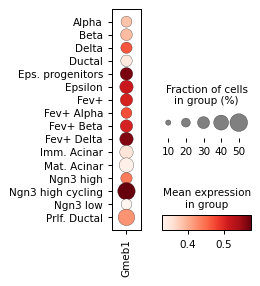
sc.pl.dotplot(rna_sel,
groupby=cell_type_key,
standard_scale='var',
show=False,
colorbar_title='mean GEX',
var_names=gene_names,
figsize=[5, 1.9])
plt.savefig('../../../output/gene_expression_pancreatic_endocrinogenesis.pdf')
plt.show()
module_names
166     CCAAT/CEBP
1467        NFAT/2
158     CREB/ATF/2
1517      KLF/SP/2
1546      GC-tract
602          TBX/1
1712         RFX/1
276           MIES
37           CUX/3
1358         FOX/4
109          NR/16
1449         ETS/1
70            NR/3
1621         FOX/7
36           CUX/1
1920       GMEB2/2
1527           EGR
1634        BCL6/2
1685         HD/23
132          NR/19
Name: module_name, dtype: object
module_names.map(res.set_index('module_name')['filter_id'].to_dict())
166      51
1467     98
158      49
1517    108
1546    112
602      69
1712    246
276      68
37       14
1358     78
109      44
1449     97
70       31
1621    163
36       13
1920    276
1527    110
1634    169
1685    203
132      47
Name: module_name, dtype: int64
module_names
166     CCAAT/CEBP
1467        NFAT/2
158     CREB/ATF/2
1517      KLF/SP/2
1546      GC-tract
602          TBX/1
1712         RFX/1
276           MIES
37           CUX/3
1358         FOX/4
109          NR/16
1449         ETS/1
70            NR/3
1621         FOX/7
36           CUX/1
1920       GMEB2/2
1527           EGR
1634        BCL6/2
1685         HD/23
132          NR/19
Name: module_name, dtype: object
anno[anno['Name'].str.contains('ETS')]
| Cluster_ID | Name | DBD | Seed_motif | Total_width | Consensus_left | Consensus_right | Cluster_size | Name_unique | |
|---|---|---|---|---|---|---|---|---|---|
| 36 | 98 | ETS/1 | ETS | EHF_ETS_1 | 25 | 7 | 17 | 71 | ETS/1 |
| 37 | 96 | ETS/2 | ETS | EHF_HUMAN.H11MO.0.B | 18 | 3 | 14 | 24 | ETS/2 |
name_by_filter_id = meta["archetypes_name"].to_dict()
name_by_filter_id[1]
'HD/1'
test_names = list(anno.sort_values('Cluster_ID')['Name'])[:1]
print(test_names)

pd.Series(test_names).map(res.set_index('module_name')['filter_id'].to_dict())
['HD/1']
0   NaN
dtype: float64
filter_id_by_name = {v: k for k, v in zip(name_by_filter_id.keys(), name_by_filter_id.values())}
for k in list(anno.sort_values('Cluster_ID')['Name']):
    if k != 'SOX/3':
        continue
    print(k)
    mb.pl.logo(
        model,
        title=False,
        xticks=False,
        rowspan_dinuc=0,
        rowspan_mono=1,
        n_rows=40,
        log_odds=True,
        # stop_at=11,
        show=False,
        # n_rows=len(res.head(20).index),
        n_cols=1,
        order=pd.Series([k]).map(filter_id_by_name) + 2,
    )  # n_cols=len(reduced_groups))
    # plt.tight_layout()
    plt.show()
SOX/3

custom_names = pd.Series(['MYB/5', 'MYB/1', 'FOX/4', 'NR/20', 'TBX/1', 'ETS/1', 'YY1', 'STAT/1', 'NR/17', 'HD/14'])
# custom_names = pd.Series(['FOX/4',])
custom_names.map(res.set_index('module_name')['filter_id'].to_dict()),
(0    251
 1    252
 2     78
 3    247
 4     69
 5     97
 6    144
 7    166
 8     45
 9     18
 dtype: int64,)
print(custom_names.map(res.set_index('module_name')['filter_id'].to_dict()))
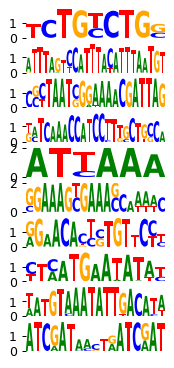
mb.pl.set_rcParams({"figure.figsize": [2, 20], "figure.dpi": 90})
mb.pl.logo(
model,
title=False,
xticks=False,
rowspan_dinuc=0,
rowspan_mono=1,
n_rows=40,
log_odds=True,
# stop_at=11,
show=False,
# n_rows=len(res.head(20).index),
n_cols=1,
order=custom_names.map(filter_id_by_name) + 2,
) # n_cols=len(reduced_groups))
# plt.tight_layout()
plt.savefig('../../../output/motif_pancreatic_endocrinogenesis_publication.pdf')
plt.show()
0    251
1    252
2     78
3    247
4     69
5     97
6    144
7    166
8     45
9     18
dtype: int64
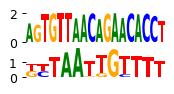
custom_names = pd.Series(['GLI', 'FOX/5'])

print(custom_names.map(res.set_index('module_name')['filter_id'].to_dict()))
mb.pl.set_rcParams({"figure.figsize": [2, 20], "figure.dpi": 90})
mb.pl.logo(
    model,
    title=False,
    xticks=False,
    rowspan_dinuc=0,
    rowspan_mono=1,
    n_rows=40,
    log_odds=True,
    # stop_at=11,
    show=False,
    # n_rows=len(res.head(20).index),
    n_cols=1,
    order=custom_names.map(filter_id_by_name) + 2,
)  # n_cols=len(reduced_groups))
# plt.tight_layout()

plt.savefig('../../../output/motif_pancreatic_neurogenesis_publication_subset.pdf')
plt.show()
0    261
1     79
dtype: int64
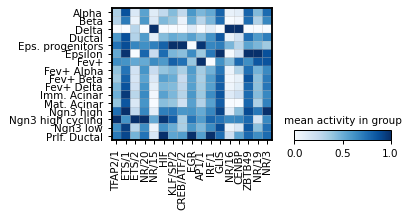
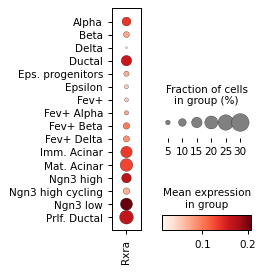
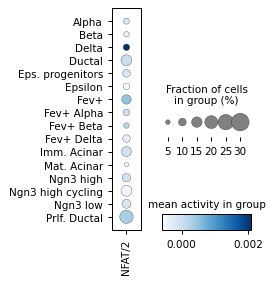
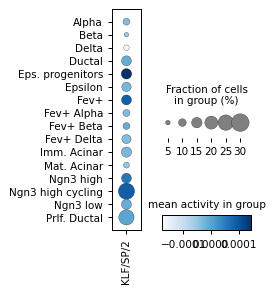
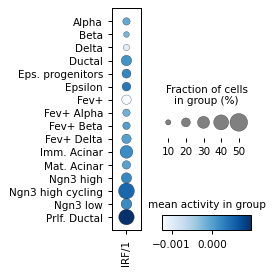
# repressors
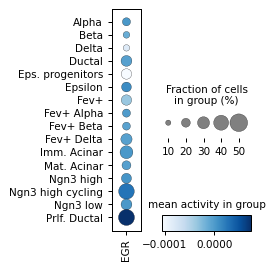
module_names = corr[corr['pearsonr'] < 0].sort_values('p_val').sort_values('p_val').groupby('cell_type').head(3)['module_name'].drop_duplicates()
gene_names = corr[corr['pearsonr'] < 0].sort_values('p_val').sort_values('p_val').groupby('cell_type').head(3)['gene_name']
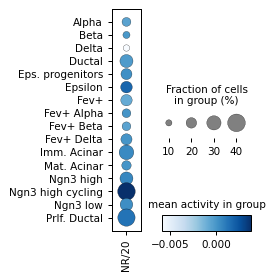
sc.pl.matrixplot(ad_act,
groupby=cell_type_key,
cmap='Blues',
var_names=module_names,
figsize=[4, 1.9],
standard_scale='var',
colorbar_title='mean activity in group')
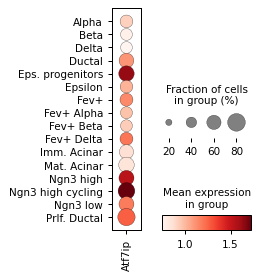
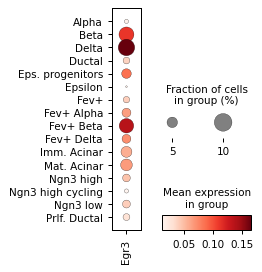
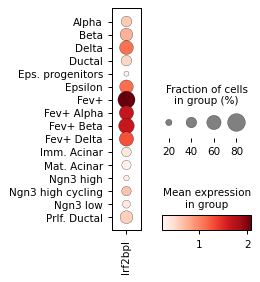
sc.pl.dotplot(rna_sel,
groupby=cell_type_key,
colorbar_title='mean GEX',
standard_scale='var',
var_names=gene_names,
figsize=[4.5, 1.9])
# sc.pl.dotplot(rna_sel, groupby='celltype', var_names=list(set(res['gene_name'])))
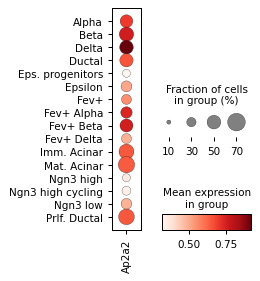
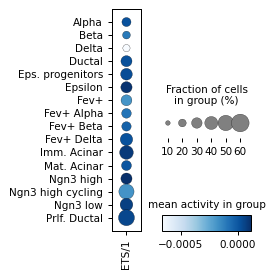
for ri, r in corr.sort_values("p_val").groupby("cell_type").head(3).iterrows():
    # ad_act.obs['HD/2'] = log_act['HD/2']
    sc.pl.dotplot(
        ad_act,
        groupby="celltype",
        cmap="Blues",
        var_names=r["module_name"],
        figsize=[2, 3.2],
        colorbar_title="mean activity in group",
    )
    sc.pl.dotplot(rna_sel, groupby="celltype", var_names=r["gene_name"], figsize=[2, 3.2])


Filter activities versus graph activities
A = model.get_log_activities()
sum_A = A.abs().sum(axis=1).cpu().detach().numpy()
A = A.squeeze(0)
print(A.shape)
torch.Size([288, 8161])
# this function assesses the contributions of A on the graph
indices, contributions, max_eig = mb.tl.compute_contributions(A.cpu(), C.cpu(),  D.cpu())

contributions_normalized = torch.abs(contributions) / max_eig
contributions_df = pd.DataFrame(contributions_normalized.detach(), columns=["index"])
print("Summary statistics of the normalized contributions: \n")
contributions_df.describe()
Summary statistics of the normalized contributions:
| index | |
|---|---|
| count | 288.000000 |
| mean | 0.377668 |
| std | 0.044241 |
| min | 0.277876 |
| 25% | 0.344783 |
| 50% | 0.377110 |
| 75% | 0.407360 |
| max | 0.496437 |
from matplotlib.pyplot import rcParams
rcParams["figure.dpi"] = 100
plt.figure(figsize=(10, 5))
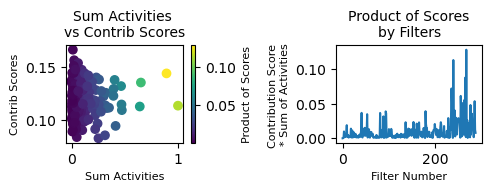
print(f"Percentage of non-zero entries of the filter matrix A: {100 * torch.sum(A != 0).item() / A.numel()} %")
mb.pl.filter_contrib_simple(contributions_normalized, A.cpu())
Percentage of non-zero entries of the filter matrix A: 100.0 %
<Figure size 1000x500 with 0 Axes>
# normalize the data, and look at summary stats
sum_A_norm = sum_A / np.max(sum_A)
sum_A_df = pd.DataFrame(sum_A.T, columns=["sum_A"])
sum_A_df.describe()
| sum_A | |
|---|---|
| count | 288.000000 |
| mean | 5.957136 |
| std | 8.597739 |
| min | 0.000547 |
| 25% | 1.099398 |
| 50% | 2.910393 |
| 75% | 7.284939 |
| max | 68.284973 |
contrib_arr = contributions_normalized.unsqueeze(dim=0).detach().numpy()
sum_A = A.cpu().abs().sum(axis=1).detach().numpy()
contrib = contrib_arr[0]

contrib_times_activities = contrib * sum_A
contrib_times_activities_norm = contrib_times_activities / np.max(contrib_times_activities)
contrib_times_activities_df = pd.DataFrame(contrib_times_activities, columns=["contribution_times_activities"])
contrib_times_activities_df.describe()
| contribution_times_activities | |
|---|---|
| count | 288.000000 |
| mean | 2.240525 |
| std | 3.305919 |
| min | 0.000212 |
| 25% | 0.422303 |
| 50% | 1.031057 |
| 75% | 2.731761 |
| max | 28.479479 |
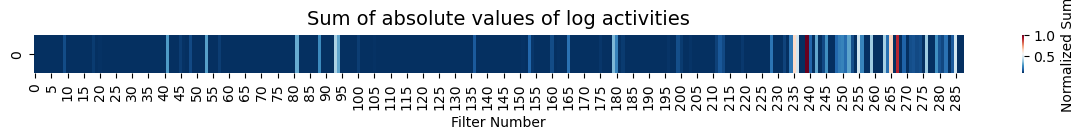
sum_A = A.cpu().abs().sum(axis=1)
sum_A_normalized = sum_A / sum_A.max()
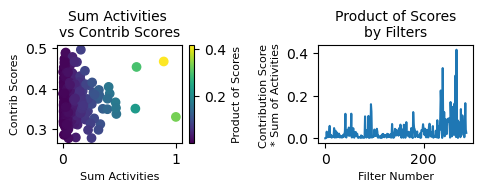
mb.pl.filter_contrib_heatmap(sum_A_normalized, title='Sum of absolute values of log activities', score="Normalized Sum")
# this function assesses the contributions of A on the graph
indices, contributions, max_singular_value = mb.tl.compute_contributions(A.cpu(), C.cpu(), D.cpu(), use_hadamard=False)
contributions_normalized = torch.abs(contributions) / max_singular_value
contrib_np = contributions_normalized.detach().numpy()
sum_A_np = sum_A_normalized.detach().numpy()
rel_idcC = np.where(contrib_np >= np.percentile(contrib_np, 75))
rel_idcA = np.where(sum_A_np >= np.percentile(sum_A_np, 75))
print(rel_idcA)
print([x for x in rel_idcC[0] if x in rel_idcA[0]])
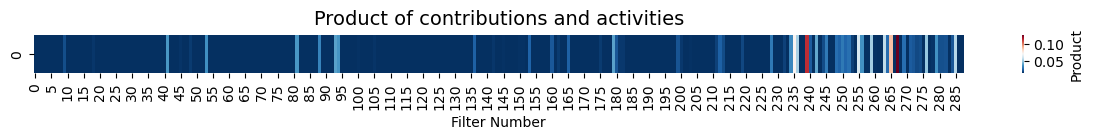
contrib_activites_prod = contributions_normalized * sum_A_normalized
print(sum(contrib_activites_prod >= np.sort(contrib_activites_prod.detach().numpy())[3*len(contrib_activites_prod) // 4])/len(contrib_activites_prod))
mb.pl.filter_contrib_heatmap(contrib_activites_prod, title="Product of contributions and activities", score="Product")
(array([  9,  18,  20,  41,  45,  46,  48,  53,  57,  81,  88,  93,  94,
       100, 105, 136, 150, 151, 153, 154, 160, 162, 165, 175, 179, 180,
       181, 182, 196, 199, 200, 203, 211, 212, 213, 219, 228, 232, 233,
       234, 235, 236, 239, 240, 242, 244, 245, 248, 249, 250, 251, 252,
       253, 255, 256, 259, 263, 264, 265, 267, 269, 271, 272, 273, 274,
       276, 279, 280, 281, 282, 284, 285]),)
[136, 160, 162, 181, 199, 212, 219, 228, 234, 248, 255, 256, 259, 263, 265, 267, 269, 271, 279, 281]
tensor(0.25)
from matplotlib.pyplot import rcParams
rcParams['figure.dpi'] = 100
plt.figure(figsize=(10, 5))


print(f"Percentage of non-zero entries of the filter matrix A: {100 * torch.sum(A != 0).item() / A.numel()} %")

mb.pl.filter_contrib_simple(contributions_normalized, A.cpu(), 'filter_contrib_plot.pdf')

plt.savefig('../../../output/contrib_scores_graph_pancreatic_endocrinogenesis.pdf')
Percentage of non-zero entries of the filter matrix A: 100.0 %
<Figure size 1000x500 with 0 Axes>
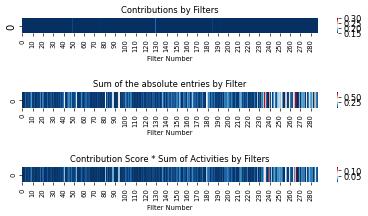
from matplotlib.pyplot import rcParams
rcParams['figure.dpi'] = 60

mb.pl.contrib_heatmaps(A.detach().cpu(), C.detach().cpu(), D.detach().cpu(), use_hadamard=False, save_pdf=True)
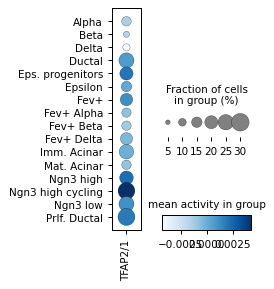
anno[anno['Name'] == 'TFAP2/1']
| Cluster_ID | Name | DBD | Seed_motif | Total_width | Consensus_left | Consensus_right | Cluster_size | Name_unique | |
|---|---|---|---|---|---|---|---|---|---|
| 215 | 264 | TFAP2/1 | TFAP | AP2A_HUMAN.H11MO.0.A | 15 | 3 | 12 | 24 | TFAP2/1 |
# grnpedia associations
ttrust = pd.read_csv('https://www.grnpedia.org/trrust/data/trrust_rawdata.mouse.tsv',
                     sep='\t',
                     header=None)
ttrust.columns = ['tf', 'target', 'role', 'ref']
ttrust = ttrust.groupby(['tf', 'role']).size().reset_index().pivot(index='tf', columns='role', values=0).fillna(0)
ttrust['consensus'] = np.where((ttrust['Activation'] > 0) & (ttrust['Repression'] == 0), 'red',
                               np.where((ttrust['Repression'] > 0) & (ttrust['Activation'] == 0), 'blue', 'purple'))
res[res['module_name'] == 'SOX/3']
| filter_id | opt_log_dynamic | archetype_id | gene_name | matched | spearman | p_val | module_name | p_adj | k | |
|---|---|---|---|---|---|---|---|---|---|---|
| 1403 | 91 | False | 92 | Sox13 | True | -0.019356 | 8.037954e-02 | SOX/3 | 1.974952e-01 | Sox13_92 |
| 1404 | 91 | False | 92 | Sox8 | True | 0.013017 | 2.396776e-01 | SOX/3 | 4.317106e-01 | Sox8_92 |
| 1405 | 91 | False | 92 | Sox30 | True | 0.022332 | 4.365840e-02 | SOX/3 | 1.264612e-01 | Sox30_92 |
| 1406 | 91 | False | 92 | Sox11 | True | -0.000002 | 9.998756e-01 | SOX/3 | 9.998756e-01 | Sox11_92 |
| 1407 | 91 | False | 92 | Sox10 | True | 0.004463 | 6.868651e-01 | SOX/3 | 8.237248e-01 | Sox10_92 |
| 1408 | 91 | False | 92 | Sox12 | True | 0.004646 | 6.747168e-01 | SOX/3 | 8.159169e-01 | Sox12_92 |
| 1409 | 91 | False | 92 | Sox9 | True | 0.112574 | 1.970287e-24 | SOX/3 | 1.311260e-22 | Sox9_92 |
| 3333 | 91 | True | 92 | Sox13 | True | -0.003547 | 7.486992e-01 | SOX/3 | 8.619085e-01 | Sox13_92 |
| 3334 | 91 | True | 92 | Sox8 | True | 0.002815 | 7.992993e-01 | SOX/3 | 8.881103e-01 | Sox8_92 |
| 3335 | 91 | True | 92 | Sox30 | True | -0.003407 | 7.582867e-01 | SOX/3 | 8.665619e-01 | Sox30_92 |
| 3336 | 91 | True | 92 | Sox11 | True | 0.024678 | 2.578970e-02 | SOX/3 | 8.429149e-02 | Sox11_92 |
| 3337 | 91 | True | 92 | Sox10 | True | 0.011439 | 3.014702e-01 | SOX/3 | 5.088216e-01 | Sox10_92 |
| 3338 | 91 | True | 92 | Sox12 | True | -0.023356 | 3.486919e-02 | SOX/3 | 1.065360e-01 | Sox12_92 |
| 3339 | 91 | True | 92 | Sox9 | True | 0.037916 | 6.127002e-04 | SOX/3 | 3.724445e-03 | Sox9_92 |
# res_sel[res_sel['module_name'] == 'SOX/3']
from matplotlib.pyplot import rcParams
rcParams['figure.dpi'] = 80

# unsqueeze the data to make it compatible with the heatmap function
sum_A_norm = sum_A_norm.reshape(1,-1)
contrib_times_activities = contrib_times_activities.reshape(1,-1)
!pip install adjustText
Collecting adjustText
  Downloading adjustText-1.2.0-py3-none-any.whl.metadata (3.0 kB)
Requirement already satisfied: numpy in /home/ilibarra/.conda/envs/mubind/lib/python3.9/site-packages (from adjustText) (1.26.4)
Requirement already satisfied: matplotlib in /home/ilibarra/.conda/envs/mubind/lib/python3.9/site-packages (from adjustText) (3.8.4)
Requirement already satisfied: scipy in /home/ilibarra/.conda/envs/mubind/lib/python3.9/site-packages (from adjustText) (1.13.0)
Requirement already satisfied: contourpy>=1.0.1 in /home/ilibarra/.conda/envs/mubind/lib/python3.9/site-packages (from matplotlib->adjustText) (1.2.1)
Requirement already satisfied: cycler>=0.10 in /home/ilibarra/.conda/envs/mubind/lib/python3.9/site-packages (from matplotlib->adjustText) (0.12.1)
Requirement already satisfied: fonttools>=4.22.0 in /home/ilibarra/.conda/envs/mubind/lib/python3.9/site-packages (from matplotlib->adjustText) (4.51.0)
Requirement already satisfied: kiwisolver>=1.3.1 in /home/ilibarra/.conda/envs/mubind/lib/python3.9/site-packages (from matplotlib->adjustText) (1.4.5)
Requirement already satisfied: packaging>=20.0 in /home/ilibarra/.conda/envs/mubind/lib/python3.9/site-packages (from matplotlib->adjustText) (24.0)
Requirement already satisfied: pillow>=8 in /home/ilibarra/.conda/envs/mubind/lib/python3.9/site-packages (from matplotlib->adjustText) (10.3.0)
Requirement already satisfied: pyparsing>=2.3.1 in /home/ilibarra/.conda/envs/mubind/lib/python3.9/site-packages (from matplotlib->adjustText) (3.1.2)
Requirement already satisfied: python-dateutil>=2.7 in /home/ilibarra/.conda/envs/mubind/lib/python3.9/site-packages (from matplotlib->adjustText) (2.9.0)
Requirement already satisfied: importlib-resources>=3.2.0 in /home/ilibarra/.conda/envs/mubind/lib/python3.9/site-packages (from matplotlib->adjustText) (6.4.0)
Requirement already satisfied: zipp>=3.1.0 in /home/ilibarra/.conda/envs/mubind/lib/python3.9/site-packages (from importlib-resources>=3.2.0->matplotlib->adjustText) (3.17.0)
Requirement already satisfied: six>=1.5 in /home/ilibarra/.conda/envs/mubind/lib/python3.9/site-packages (from python-dateutil>=2.7->matplotlib->adjustText) (1.16.0)
Downloading adjustText-1.2.0-py3-none-any.whl (12 kB)
Installing collected packages: adjustText
Successfully installed adjustText-1.2.0
from adjustText import adjust_text
rcParams['figure.figsize'] = 3, 3
rcParams['figure.dpi'] = 135
rcParams['pdf.fonttype'] = 42

def delta_models(model_by_logdynamic):
    model = model_by_logdynamic[True]
    log_act1 = torch.stack(list(model.activities.log_activities), dim=1).squeeze(0)
    log_act1 = pd.DataFrame(log_act1.detach().cpu().numpy())

    model = model_by_logdynamic[False]
    log_act2 = torch.stack(list(model.activities.log_activities), dim=1).squeeze(0)
    log_act2 = pd.DataFrame(log_act2.detach().cpu().numpy())

    d = log_act1.mean(axis=0) - log_act2.mean(axis=0)
    # d.index = ad.obs_names
    return d

# graph = True - graph = False
delta_model = delta_models(model_by_logdynamic)
delta_model
delta_model = delta_model[2:]
delta_model.index = range(len(delta_model))
delta_model.index += 1
delta_model.index = delta_model.index.map(name_by_filter_id)
delta_model

res['act_change'] = res['module_name'].map(delta_model.to_dict())
res['k'] = res['module_name'] + ':' + res['gene_name']
res['graph_score'] = res['filter_id'].map({i : contrib_times_activities[0][i + 2] for i in range(len(contrib_times_activities[0]) - 2)})
res['z'] = np.sqrt((res['graph_score'] ** 2) * (-np.log(res['p_adj'] + 1e-10)) ** 2)
# only show weights with Graph Layer on
res_sel = res.copy() # [res['opt_log_dynamic']]
res.shape, res_sel.shape
((3860, 13), (3860, 13))
ax = plt.subplot()
cmap = sns.color_palette('RdBu_r', as_cmap=True)
res_sel = res_sel.sort_values('z', ascending=False) # .drop_duplicates('module_name')
# res_sel = res_sel.drop_duplicates('module_name')
# res_sel['x'] = np.log((res_sel['graph_score'] + 1) * (res_sel['act_change'].abs() + 1))
res_sel['x'] = res_sel['graph_score'] * res_sel['act_change'].abs() * res_sel['spearman'].abs()
# res_sel['x'] = res_sel['act_change'].abs() * res_sel['spearman'].abs()
# general noise stacking of cells on x-y axes
sigma = 0.001
mu =0.00
# generate normally distributed samples
noise = sigma * np.random.randn(res_sel.shape[0]) + mu
res_sel['x'] = res_sel['x'] + noise
res_sel['spearman'] = res_sel['spearman'] + noise
edgecolors = res_sel['gene_name'].map(ttrust['consensus'].to_dict())
edgecolors = np.where(~pd.isnull(edgecolors), edgecolors, 'gray')
res_sel['edgecolors'] = edgecolors
for show_log_dynamic in [True,]:
res_plot = res_sel[res_sel['opt_log_dynamic'] == show_log_dynamic]
plt.scatter(res_plot['x'],
res_plot['spearman'],
s=-np.log(res_plot['p_adj'] + 1e-10),
cmap=cmap,
lw=.3,
marker='o' if show_log_dynamic else '^',
edgecolors='gray',
c=res_plot['act_change'])
plt.axhline(y=0, ls='--', c='gray')
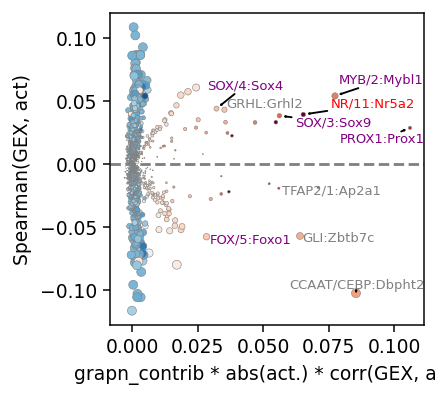
plt.xlabel('grapn_contrib * abs(act.) * corr(GEX, act)')
plt.ylabel('Spearman(GEX, act)')
res_plot = res_plot.sort_values('x', ascending=False).drop_duplicates('module_name')
texts = [] # [plt.text(x[i], y[i], 'Text%s' %i, ha='center', va='center') for i in range(len(x))]
for ri, r in res_plot.head(10).iterrows():
print(r['module_name'] + ':' + r['gene_name'], (r['x'], r['spearman']), r['act_change'], r['edgecolors'])
t = ax.annotate(r['module_name'] + ':' + r['gene_name'], (r['x'], r['spearman']), fontsize=7, color=r['edgecolors'])
texts.append(t)
adjust_text(texts, arrowprops=dict(arrowstyle='->'))
plt.savefig('../../../output/graph_contribution_pancreatic_endocrinogesis.pdf')
plt.show()
PROX1:Prox1 (0.1059767525471204, 0.028886475849371568) 0.16746491193771362 purple
CCAAT/CEBP:Dbpht2 (0.08536277658217145, -0.10255250768984316) 0.10485882312059402 gray
MYB/2:Mybl1 (0.07734918164531444, 0.05428451893348915) 0.12227752804756165 purple
NR/11:Nr5a2 (0.06523281984085992, 0.03952495182055314) 0.21196624636650085 red
GLI:Zbtb7c (0.06397115296691377, -0.05706246215981071) 0.09551192820072174 gray
SOX/3:Sox9 (0.05609969940570946, 0.03852411756917732) 0.1335025131702423 purple
TFAP2/1:Ap2a1 (0.055899889740226597, -0.019106576198307353) 0.15999287366867065 gray
GRHL:Grhl2 (0.03513197853410249, 0.04331429681436185) 0.08097979426383972 gray
SOX/4:Sox4 (0.03209149718337514, 0.044195799745043826) 0.08338265866041183 purple
FOX/5:Foxo1 (0.028284020278165116, -0.05766508859818134) 0.07688487321138382 purple
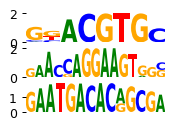
mb.pl.set_rcParams({"figure.figsize": [2, 20], "figure.dpi": 90})
mb.pl.logo(
    model,
    log_odds=True,
    title=False,
    xticks=False,
    rowspan_dinuc=0,
    rowspan_mono=1,
    n_rows=40,
    # stop_at=11,
    show=False,
    # n_rows=len(res.head(20).index),
    n_cols=1,
    order=pd.Series(['SOX/3', 'NR/11', 'CCAAT/CEBP']).map(res.set_index('module_name')['filter_id'].to_dict()),
)  # n_cols=len(reduced_groups))
# plt.tight_layout()

plt.savefig('../../../output/motif_pancreatic_endocrinogenesis.pdf')
plt.show()
import pylab as pl
import numpy as np
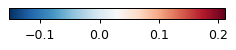
a = np.array([[res_sel['act_change'].min(), res_sel['act_change'].max()]])
pl.figure(figsize=(3, .2))
img = pl.imshow(a, cmap="RdBu_r")
pl.gca().set_visible(False)
cax = pl.axes([0.1, 0.2, 0.8, 0.6])
pl.colorbar(orientation="horizontal", cax=cax)
pl.savefig("../../../output/graph_contribution_pancreatic_endocrinogenesis_cbar.pdf")
scv.tl.velocity_pseudotime(rna)
# scv.pl.scatter(rna, color="velocity_pseudotime", color_map="gnuplot")
computing terminal states
    identified 10 regions of root cells and 1 region of end points .
    finished (0:00:03) --> added
    'root_cells', root cells of Markov diffusion process (adata.obs)
    'end_points', end points of Markov diffusion process (adata.obs)
def running_mean(y_in, x_in, N_out=101, sigma=.05):
    '''
    Returns running mean as a Bell-curve weighted average at evenly spaced
    points. Does NOT wrap signal around, or pad with zeros.

    Arguments:
    y_in -- y values, the values to be smoothed and re-sampled
    x_in -- x values for array

    Keyword arguments:
    N_out -- NoOf elements in resampled array.
    sigma -- 'Width' of Bell-curve in units of param x .
    '''
    import numpy as np
    N_in = len(y_in)

    # Gaussian kernel
    x_out = np.linspace(np.min(x_in), np.max(x_in), N_out)
    x_in_mesh, x_out_mesh = np.meshgrid(x_in, x_out)
    gauss_kernel = np.exp(-np.square(x_in_mesh - x_out_mesh) / (2 * sigma**2))
    # Normalize kernel, such that the sum is one along axis 1
    normalization = np.tile(np.reshape(np.sum(gauss_kernel, axis=1), (N_out, 1)), (1, N_in))
    gauss_kernel_normalized = gauss_kernel / normalization
    # Perform running average as a linear operation
    y_out = gauss_kernel_normalized @ y_in

    return y_out, x_out
# prepare velocity pseudotime values for visualization
atac.obs['velocity_pseudotime'] = rna.obs['velocity_pseudotime'].values
ad.obs['velocity_pseudotime'] = atac.obs['velocity_pseudotime']
Given a few potential genes, verify its association with chromatin targets
def plot_pseudotime(gene_name, filter_name, sigma_gex=.05, sigma_filter=.1, save=None):
    rcParams['figure.figsize'] = 3, 2
    gene_key = gene_name
    x = rna.obs['velocity_pseudotime']
    y = rna[:,rna.var_names==gene_key].X.A.flatten()
    y = np.log(y)
    y[y == -np.inf] = np.nanmin(y[y != -np.inf])

    y_mean, x_mean = running_mean(y, x, sigma=sigma_gex)
    plt.scatter(x, y, edgecolors=None, color='lightgreen', s=.1)
    plt.plot(x_mean, y_mean, color='green')
    plt.ylabel('')
    plt.title(gene_key)
    plt.ylabel('gene expression [log]')
    plt.xlabel('pseudotime')


    x = ad.obs['velocity_pseudotime']

    if save is not None:
        plt.savefig(save + '_gex.pdf')
    plt.show()
    filter_id = int(res[res['module_name'].str.contains(filter_name)]['filter_id'].values[0])

    y= act.T.numpy()[:,filter_id]
    # y = np.abs(y)
    # y = np.log(y)
    # y[y == -np.inf] = np.nanmin(y[y != -np.inf])

    y_mean, x_mean = running_mean(y, x, sigma=sigma_filter)
    # plt.scatter(x, y, edgecolors='black', color='lightgreen', s=.1)
    plt.plot(x_mean, y_mean, color='red')
    plt.ylabel('')
    plt.title('filter activities %s' % filter_name)
    plt.ylabel('filter activity')
    plt.xlabel('pseudotime')

    if save is not None:
        plt.savefig(save + '_filter.pdf')

    # plt.close()
    plt.show()
# plot_pseudotime('Foxa2', 'FOXA/1', sigma_gex=.01, sigma_filter=.1,
#                 save="../../../output/pancreas_mafa_bzip")
plot_pseudotime('Mafa', 'AP1/2', sigma_gex=.01, sigma_filter=.1,
                save="../../../output/pancreas_mafa_bzip")
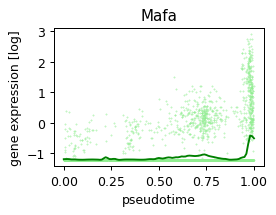
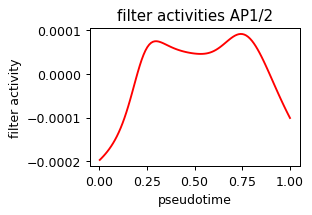
plt.rcParams["font.family"] = 'sans-serif' # None # "Arial"

plot_pseudotime('Sox9', 'SOX/3', sigma_gex=.01, sigma_filter=.1,
                save="../../../output/pancreas_sox9_sox3")

plot_pseudotime('Cux1', 'CUX/2', sigma_gex=.01, sigma_filter=.1,
                save="../../../output/pancreas_cux1_cux2")
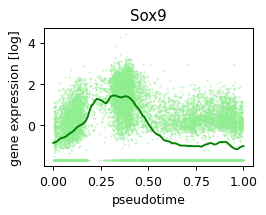
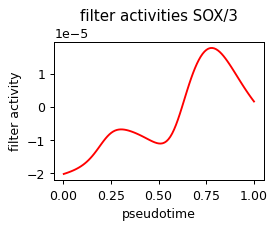
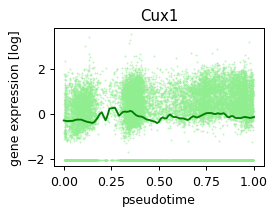
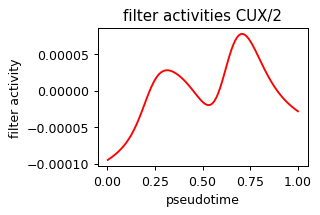
plot_pseudotime('Insm1', 'INSM1', sigma_gex=.01, sigma_filter=.05,
                save="../../../output/pancreas_CCAAT_CEBP_dbpht2")
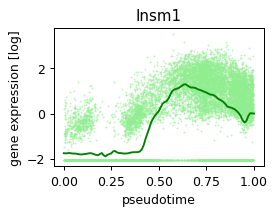
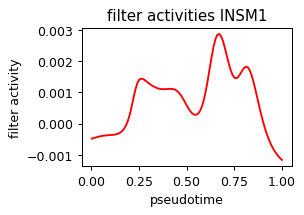
plot_pseudotime('Pax6', 'PAX/1', sigma_gex=.01, sigma_filter=.05,
                save="../../../output/pancreas_CCAAT_CEBP_dbpht2")
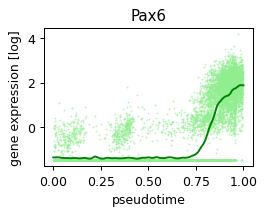
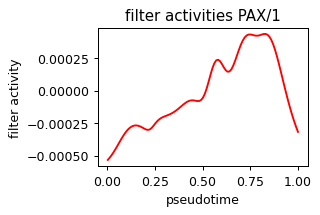
res
| filter_id | opt_log_dynamic | archetype_id | gene_name | matched | spearman | p_val | module_name | p_adj | k | act_change | graph_score | z | |
|---|---|---|---|---|---|---|---|---|---|---|---|---|---|
| 0 | 1 | False | 2 | Pou6f1 | True | -0.012835 | 2.463036e-01 | HD/2 | 4.397465e-01 | HD/2:Pou6f1 | -0.033147 | 2.135972 | 1.754823 |
| 1 | 1 | False | 2 | Pou6f2 | True | -0.004708 | 6.706317e-01 | HD/2 | 8.131867e-01 | HD/2:Pou6f2 | -0.033147 | 2.135972 | 0.441707 |
| 2 | 1 | False | 2 | Nkx6-1 | True | 0.019021 | 8.575862e-02 | HD/2 | 2.067634e-01 | HD/2:Nkx6-1 | -0.033147 | 2.135972 | 3.366677 |
| 3 | 1 | False | 2 | Dlx1as | True | -0.011318 | 3.066163e-01 | HD/2 | 5.133309e-01 | HD/2:Dlx1as | -0.033147 | 2.135972 | 1.424340 |
| 4 | 1 | False | 2 | Lmx1b | True | -0.011210 | 3.112775e-01 | HD/2 | 5.183482e-01 | HD/2:Lmx1b | -0.033147 | 2.135972 | 1.403565 |
| ... | ... | ... | ... | ... | ... | ... | ... | ... | ... | ... | ... | ... | ... |
| 3855 | 280 | True | 281 | Pax6 | True | -0.080454 | 3.368429e-13 | PAX/1 | 9.490611e-12 | PAX/1:Pax6 | 0.045139 | 4.515195 | 103.556830 |
| 3856 | 280 | True | 281 | Pax6os1 | True | -0.041961 | 1.495984e-04 | PAX/1 | 1.075326e-03 | PAX/1:Pax6os1 | 0.045139 | 4.515195 | 30.861954 |
| 3857 | 282 | True | 283 | Pax2 | True | -0.003662 | 7.408379e-01 | PAX-halfsite | 8.568437e-01 | PAX-halfsite:Pax2 | 0.024079 | 4.426369 | 0.683873 |
| 3858 | 283 | True | 284 | Ahr | True | 0.023966 | 3.038693e-02 | AHR | 9.556552e-02 | AHR:Ahr | 0.099753 | 11.301592 | 26.535496 |
| 3859 | 284 | True | 285 | Klf8 | True | -0.019348 | 8.050853e-02 | KLF/SP/3 | 1.976863e-01 | KLF/SP/3:Klf8 | -0.028565 | 2.733040 | 4.430459 |
3860 rows × 13 columns
plot_pseudotime('Cebpa', 'CCAAT/CEBP', sigma_gex=.01, sigma_filter=.05,
                save="../../../output/pancreas_CCAAT_CEBP_dbpht2")
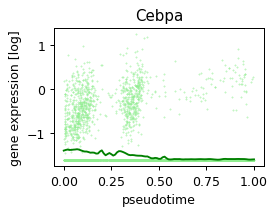
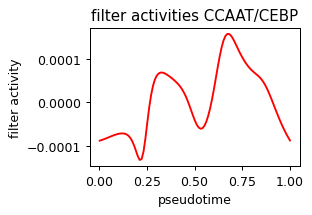
plot_pseudotime('Dbpht2', 'CCAAT/CEBP', sigma_gex=.01, sigma_filter=.05,
                save="../../../output/pancreas_CCAAT_CEBP_dbpht2")
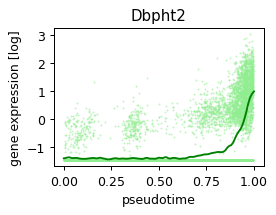
plot_pseudotime('Nr5a2', 'NR/11', sigma_gex=.01, sigma_filter=.05,
                save="../../../output/pancreas_nr5a2_nr11")
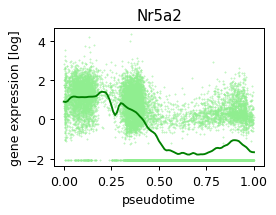
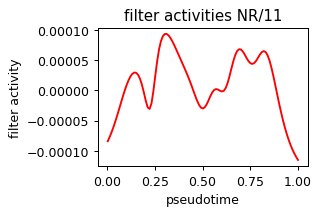
def plot_chromatin(filter_name, sigma_chrom,
                   group_key=None, key_sel=None,
                   q_thr=.95, show=True, save=None):
    res_sel = res[res['module_name'].str.contains(filter_name)]['filter_id']
    if res_sel.shape[0] == 0:
        print('not found')
        return None
    filter_id = int(res_sel.values[0])
    # print(filter_id)
    scores = binding_per_mode[:,filter_id]
    # filter scores across regions
    # plt.hist(scores)

    if group_key is not None and key_sel is not None:
        ad_sel = ad[ad.obs[group_key] == key_sel]
    else:
        ad_sel = ad
    # print('here')

    var_idx = np.argwhere(scores >= np.quantile(scores, q_thr)).flatten()
    var_names = ad_sel.var_names[var_idx]
    # print(q_thr, var_names.shape)
    # background with all peaks
    var_names_neg = ad_sel.var_names[~ad.var_names.isin(var_names)]

    x = ad_sel.obs['velocity_pseudotime']
    y = ad_sel[:,var_names].X.mean(axis=1).A.flatten()
    # y = np.log(y)
    # y[y == -np.inf] = np.nanmin(y[y != -np.inf])
    y_mean, x_mean = running_mean(y, x, sigma=sigma_chrom)
    plt.scatter(x, y, edgecolors=None, color='lightblue', s=.1)
    plt.plot(x_mean, y_mean, color='blue', label='targets')
    plt.ylabel('')
    plt.title(filter_name + ((', %s' % key_sel) if key_sel is not None else ''))
    plt.ylabel('chromatin accessibility [mean]')
    plt.xlabel('pseudotime')
    # plt.show()

    # print(q_thr, var_names_neg.shape)
    x = ad_sel.obs['velocity_pseudotime']
    y = ad_sel[:,var_names_neg].X.mean(axis=1).A.flatten()
    # y = np.log(y)
    # y[y == -np.inf] = np.nanmin(y[y != -np.inf])
    y_mean_avr, x_mean = running_mean(y, x, sigma=sigma_chrom)
    # plt.scatter(x, y, edgecolors=None, color='lightblue', s=.1)
    plt.plot(x_mean, y_mean_avr, color='gray', linestyle='--', label='non-targets')
    plt.ylabel('')
    plt.ylabel('chromatin accessibility [mean]')
    plt.xlabel('pseudotime')
    plt.legend()

    if save is not None:
        plt.savefig(save + '_filter.pdf')
    if not show:
        plt.close()
    else:
        plt.show()
    return (y_mean - y_mean_avr).sum()
sigma_chrom = .1
# plot_chromatin('INSM1', sigma_chrom, group_key='celltype',
#                # key_sel='Beta',
#                q_thr=.86, show=True, save=None)
plot_chromatin('AP1/2', sigma_chrom, group_key='celltype',
               # key_sel='Beta',
               q_thr=.84, show=True, save=None)
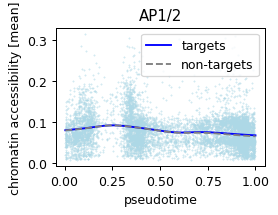
0.08973802337474156
plot_chromatin('AP1/2', sigma_chrom, group_key='celltype', key_sel='Beta', q_thr=.84, show=True, save=None)
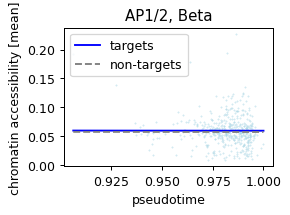
0.22364762461104337
plot_pseudotime('Mafa', 'AP1/2', sigma_gex=.01, sigma_filter=.1,
                save="../../../output/pancreas_mafa_bzip")
plot_chromatin('AP1/2', sigma_chrom, group_key='celltype', q_thr=.95, show=True, save='../../../output/pancreas_ap1_1')

0.18744242662916832
sigma_chrom
0.1
rcParams['figure.figsize'] = 3, 2
plot_chromatin('SOX/3', .04, q_thr=.95, show=True, save='../../../output/pancreas_sox3')
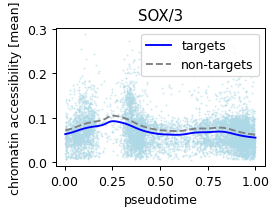
-0.9421069034107382
# plt.close()
plot_chromatin('NR/11', sigma_chrom, q_thr=.9, show=True, save='../../../output/pancreas_nr11')
plot_chromatin('CCAAT/CEBP', sigma_chrom, q_thr=.9, show=True, save='../../../output/pancreas_ccaat')
39
here
0.9 (5000,)
0.9 (45000,)

51
here
0.9 (5000,)
0.9 (45000,)
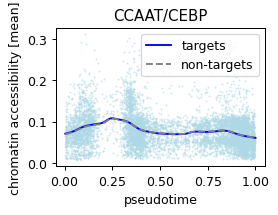
0.0034247913106122754
anno[anno['Name'] == 'CCAAT/CEBP']
| Cluster_ID | Name | DBD | Seed_motif | Total_width | Consensus_left | Consensus_right | Cluster_size | Name_unique | |
|---|---|---|---|---|---|---|---|---|---|
| 9 | 52 | CCAAT/CEBP | bZIP | CEBPA_HUMAN.H11MO.0.A | 14 | 2 | 11 | 37 | CCAAT/CEBP |
plot_chromatin('NR/20', sigma_chrom, q_thr=.9, show=True, save='../../../output/pancreas_ccaat')
247
here
0.9 (5000,)
0.9 (45000,)

0.08752305422098165
module_names = set(res['module_name'])

diff_pseudotime_by_module = []
for name in module_names:
    sigma_chrom = .03
    diff = plot_chromatin(name, sigma_chrom, q_thr=.99, show=False)
    diff_pseudotime_by_module.append([name, diff])
    print(name, diff)
# filter_name = 'SOX/4'
# sigma_chrom = .03
# plot_chromatin(filter_name, sigma_chrom, q_thr=.9)

# filter_name = 'SOX/3'
# sigma_chrom = .03
# plot_chromatin(filter_name, sigma_chrom, q_thr=.84)

# filter_name = 'NR/11'
# sigma_chrom = .02
# plot_chromatin(filter_name, sigma_chrom, q_thr=.95)

# filter_name = 'PAX/1'
# sigma_chrom = .03
# plot_chromatin(filter_name, sigma_chrom, q_thr=.99)
chrom = pd.DataFrame(diff_pseudotime_by_module, columns=['module', 'diff'])
Ebox/CAGATGG -0.4463687105064015
ETS/2 1.3841551210348784
NFKB/3 -0.029245373729375405
HIC/1 -0.00970106750741416
SOX/4 -0.3864617779577727
ZIC/2 -0.001678147728974927
NRF1 -1.2149584090135126
Ebox/CACGTG/2 0.7070329100372075
GC-tract -0.352908705694854
AIRE -0.039780363278249894
NR/16 0.3818001510819134
CCAAT/CEBP -1.0215220720248988
ZNF28 -1.054292635566007
HD/25 -0.3858228067283669
HD/18 0.3678626404024407
BATF 0.8496393614191722
YY1 -0.6374268295097316
SOX/3 -0.9099718303214782
Ebox/CACGTG/1 -0.7772530907996553
EBF1 -0.011737208270374451
HLTF -1.4430974820992746
STAT/2 0.623677270427765
NR/5 -0.42165050996851433
SNAI2 -0.029305342214546663
SMAD 2.878415515952871
E2F/3 0.6617957710935988
CPEB1 0.7573968834971179
MYB/1 0.5095461009114091
SREBF1 -0.011737208270374451
SOX/6 0.9916724448590001
POU/3 -0.8682258245449043
CENBP 2.0772878400552517
NFAT/1 -0.34609716253812495
CREB/ATF/1 0.9182118987611131
CREB/ATF/3 -0.5941427179558985
CUX/2 -0.6188109979961864
BCL6/1 1.2951623121745122
TBX/1 -1.3559940045587469
HINFP1/1 -1.5303903573608182
MZF1 -0.269106254500437
FOX/3 0.12013514531092945
SOX/2 -1.2940562392934727
TFCP2 0.8031191300914624
MYB/4 0.9103189912274473
CUX/1 1.1215119488121088
CUX/3 0.29181685167803084
KLF/SP/1 -0.17357936918552327
RFX/2 0.3521208815920952
Ebox/CACCTG -0.5955704048416309
THAP1 -1.9091206461738328
CTCF 0.44687916088007046
MEF2 0.1635619585574609
MYB/5 0.4092221525942972
AP1/2 -0.506526387942535
Ebox/CATATG 0.45124144500690305
PRDM5 -0.6680187729554607
FOX/8 0.0076614966463977655
E2F/2 -0.32548537360772734
NR/18 -0.5466794047176766
RFX/1 -0.6461101872451352
GRHL -1.3244764670712648
NFKB/1 1.2090884408490437
NFKB/2 0.7544892817965362
ZNF652 -0.5338940794041547
AHR -0.33197457694038185
AP1/1 -0.3268777906682992
MFZ1 0.7677125318222324
KLF/SP/2 -0.31925204287720027
MTF1 -0.3258488261698437
ZBTB6 -0.10000325671211306
HD/12 0.9101176561806534
NR/13 0.4560247083688173
IRF/2 0.9093056990396887
ZNF143 0.5363586702724903
SPDEF/2 -0.4574884274506151
SOX/7 -0.1153157149687983
GMEB2/1 -0.6271663119194868
NFAT/3 0.07432299166620979
NFY -1.6461554626977613
ARI5A 0.4251164076398737
TFAP2/1 -0.9052591695452773
MAF 0.4594316204324637
NR/4 -0.6653371118495084
NFI/1 -0.2783801401994053
MYB/2 -0.6362792614752368
ZNF57 -1.1678015258122054
NR/12 1.0894008039296366
SPI -0.6719526048927651
RFX/3 0.5670336899417951
ZNF354 0.3525071993381236
PROX1 1.1441262017983782
EVI1/MECOM -0.29520508316697247
SIX/1 0.07510179285768168
GMEB2/3 0.5913462726776078
TEAD -0.4197771402411455
NR/9 -0.2572733766197498
ZFX -1.7060761730650642
RUNX/1 -0.8441002081772531
FOX/4 -0.9445048565787458
HIF 2.988408540447653
ZBTB49 4.61222487160048
SOX/8 -0.5897541586694709
NR/15 1.5481448063153085
NR/7 -1.269722056372812
RBPJ 0.08975539408227676
HD/2 0.3759806619383275
GFI 0.7317949107776258
IRF/4 1.419556142926688
HOMEZ 0.5250855589346416
RUNX/2 -0.22911510471596072
SPDEF/1 1.1989329740969454
MBD2 -1.0711031111034617
PAX/1 0.18441886935943502
HD/23 -0.3200864666275924
TFAP2/2 -0.01604517405709123
CUX/4 0.22015045232037822
GATA -0.4314637860847894
NR/8 -0.8030136673458672
FOX/2 0.11775062419502871
MIES -0.8343979180887662
STAT/1 -1.5314400032238316
ZNF335 -0.9634653239907858
NFAT/2 -0.4506339818594068
TBX/3 1.1035565572051376
REST/NRSF 0.32063332120127175
PRDM4 1.0778408489240316
not found
DDIT3+CEBPA None
NR/19 -0.3005369734642561
FOX/5 -0.04673500355458831
REL-halfsite 0.4696085724406287
SRF 0.6294870391308862
PRDM1 1.5176165664667574
HSF -0.28191747989649496
IRF/3 -0.3206631772555406
KAISO -0.7270061463859222
INSM1 -0.8884641435669692
NR/10 1.4369850871875558
NR/17 -0.39727253302943316
POU/1 -0.34026029460175766
FOX/6 0.8488835522295665
E2F/1 1.4304759897485635
TBX/2 0.40736994566822715
TCF/LEF -0.7589635724686599
NFAT/4 -0.1414585941453083
MECP2 2.353791634013215
LEF1 2.325734770600728
Ebox/CAGCTG -0.007602971200395749
PRDM9 -0.1529234092127609
POU/2 0.908282790551908
SOX/1 -2.4064246885340195
KLF/SP/3 -1.8180654670276561
NR/1 -0.8211190329059841
NR/6 0.9937804791238484
FOX/7 -0.4386088817687715
GMEB2/2 0.03700352721580165
NFI/2 0.2031417942876867
ETS/1 -0.49967628311850165
GLI 0.26015841392168393
SOX/5 -0.7648320115736118
TBX/4 0.841269354310839
GLIS 0.26015841392168393
NR/11 -0.6398790374906249
MYB/3 -1.0622625244751394
HD/14 -0.8802136657485213
HD/16 0.4504262671789152
CREB/ATF/2 0.8406829665624733
EGR -0.22523820468322242
IRF/1 1.8354912001501464
TATA -0.20443965986626844
E2F/4 -0.27389699491361663
NFI/3 0.8159721782938699
NR/3 0.6205652809645038
OVOL1 0.7590182676318638
PAX-halfsite -0.912170224212366
BCL6/2 5.462366565318233
CREB3/XBP1 0.4618577576952723
not found
OCT4+SOX2 None
PLAG1 -0.062016821623390166
HD/10 -0.13492179651312536
NR/20 -0.38186017057189237
HD/8 0.4624420522161476
LIN54 0.5553670719942171