Mouse neurogenesis scRNA-seq (Noack et al. 2022) | Model evaluation
Here we compared the weights learned by several model iterations, to highlight
Performance user parameter combinations
Interpretation based on TF regulators
Coherence or learned graph-weights when assisting RNA-weights, or only using ATAC-weights
%load_ext autoreload
%autoreload 2
cd ~/workspace/theislab/mubind/docs/notebooks/single_cell
/home/ilibarra/workspace/theislab/mubind/docs/notebooks/single_cell
/home/ilibarra/miniconda3/envs/mubind/lib/python3.9/site-packages/IPython/core/magics/osm.py:393: UserWarning: using bookmarks requires you to install the `pickleshare` library.
  bkms = self.shell.db.get('bookmarks', {})
/home/ilibarra/miniconda3/envs/mubind/lib/python3.9/site-packages/IPython/core/magics/osm.py:417: UserWarning: using dhist requires you to install the `pickleshare` library.
  self.shell.db['dhist'] = compress_dhist(dhist)[-100:]
!readlink -f .
/home/ilibarra/workspace/theislab/mubind/docs/notebooks/single_cell
import torch
import mubind as mb
import scanpy as sc
!ls -ltrh /home/ilibarra/workspace/theislab/mubind/docs/notebooks/single_cell/noack_2022*
-rw-rw-r-- 1 ilibarra ilibarra  18M Jun 10 02:06 /home/ilibarra/workspace/theislab/mubind/docs/notebooks/single_cell/noack_2022_use_logdynamic_0.pth
-rw-rw-r-- 1 ilibarra ilibarra  21M Jun 10 02:06 /home/ilibarra/workspace/theislab/mubind/docs/notebooks/single_cell/noack_2022_use_logdynamic_1.pth
-rw-rw-r-- 1 ilibarra ilibarra 909M Jun 10 02:06 /home/ilibarra/workspace/theislab/mubind/docs/notebooks/single_cell/noack_2022_sample_train.h5ad
-rw-rw-r-- 1 ilibarra ilibarra  18M Jun 13 02:51 /home/ilibarra/workspace/theislab/mubind/docs/notebooks/single_cell/noack_2022_use_logdynamic_0_obs7468.pth
-rw-rw-r-- 1 ilibarra ilibarra  21M Jun 13 02:51 /home/ilibarra/workspace/theislab/mubind/docs/notebooks/single_cell/noack_2022_use_logdynamic_1_obs7468.pth
-rw-rw-r-- 1 ilibarra ilibarra 887M Jun 13 02:51 /home/ilibarra/workspace/theislab/mubind/docs/notebooks/single_cell/noack_2022_sample_train_obs7468.h5ad
-rw-rw-r-- 1 ilibarra ilibarra 833K Jul  5 00:27 /home/ilibarra/workspace/theislab/mubind/docs/notebooks/single_cell/noack_2022_use_logdynamic_0_obs86.pth
-rw-rw-r-- 1 ilibarra ilibarra 836K Jul  5 00:27 /home/ilibarra/workspace/theislab/mubind/docs/notebooks/single_cell/noack_2022_use_logdynamic_1_obs86.pth
-rw-rw-r-- 1 ilibarra ilibarra  22M Jul  5 00:27 /home/ilibarra/workspace/theislab/mubind/docs/notebooks/single_cell/noack_2022_sample_train_obs86.h5ad
-rw-rw-r-- 1 ilibarra ilibarra 1.5M Jul  5 00:51 /home/ilibarra/workspace/theislab/mubind/docs/notebooks/single_cell/noack_2022_use_logdynamic_0_obs386.pth
-rw-rw-r-- 1 ilibarra ilibarra 1.6M Jul  5 00:51 /home/ilibarra/workspace/theislab/mubind/docs/notebooks/single_cell/noack_2022_use_logdynamic_1_obs386.pth
-rw-rw-r-- 1 ilibarra ilibarra  57M Jul  5 00:51 /home/ilibarra/workspace/theislab/mubind/docs/notebooks/single_cell/noack_2022_sample_train_obs386.h5ad
-rw-rw-r-- 1 ilibarra ilibarra  17M Jul  8 03:27 /home/ilibarra/workspace/theislab/mubind/docs/notebooks/single_cell/noack_2022_use_logdynamic_0_obs7359.pth
-rw-rw-r-- 1 ilibarra ilibarra  21M Jul  8 03:27 /home/ilibarra/workspace/theislab/mubind/docs/notebooks/single_cell/noack_2022_use_logdynamic_1_obs7359.pth
-rw-rw-r-- 1 ilibarra ilibarra 875M Jul  8 03:27 /home/ilibarra/workspace/theislab/mubind/docs/notebooks/single_cell/noack_2022_sample_train_obs7359.h5ad
-rw-rw-r-- 1 ilibarra ilibarra  17M Jul 20 18:14 /home/ilibarra/workspace/theislab/mubind/docs/notebooks/single_cell/noack_2022_use_logdynamic_0_obs7359_var1948.pth
-rw-rw-r-- 1 ilibarra ilibarra  21M Jul 20 18:14 /home/ilibarra/workspace/theislab/mubind/docs/notebooks/single_cell/noack_2022_use_logdynamic_1_obs7359_var1948.pth
-rw-rw-r-- 1 ilibarra ilibarra 875M Jul 20 18:14 /home/ilibarra/workspace/theislab/mubind/docs/notebooks/single_cell/noack_2022_sample_train_obs7359_var1948.h5ad
pwd
'/home/ilibarra/workspace/theislab/mubind/docs/notebooks/single_cell'
# query
# obs_id = 7468 # publication case
obs_id = 7359 # testing hadamard
# 7359
import os
# load models
model_by_logdynamic = {}
for use_logdynamic in [False, True]:
    p = 'noack_2022_use_logdynamic_%i_obs%s.pth' % (use_logdynamic, obs_id)
    print(os.path.exists(p), p)
    model_by_logdynamic[use_logdynamic] = torch.load(p)
True noack_2022_use_logdynamic_0_obs7359.pth
True noack_2022_use_logdynamic_1_obs7359.pth
ad = sc.read_h5ad('noack_2022_sample_train_obs%s.h5ad' % obs_id)
# ad = sc.read_h5ad('atac_train.h5ad')
#rna_sample = sc.read_h5ad('rna_sample_train.h5ad')
rna_sample = ad
rna_sample.shape
(7359, 1948)
import pickle
train = pickle.load(open('train_dataloader_obs%s.pkl' % obs_id, 'rb'))
%load_ext line_profiler
# # load the pancreas multiome dataset
# rna, atac = mb.datasets.pancreas_multiome() # data_directory='../../../annotations/scatac')
# %lprun -f model.forward model.optimize_iterative(train, n_epochs=10, skip_kernels=list([0]) + list(range(2, 500)), opt_kernel_shift=[0, 0] + [0] * (n_kernels), opt_kernel_length=[0, 0] + [0] * (n_kernels))
# %lprun -f model.binding_modes.forward model.optimize_iterative(train, n_epochs=10, skip_kernels=list([0]) + list(range(2, 500)), opt_kernel_shift=[0, 0] + [0] * (n_kernels), opt_kernel_length=[0, 0] + [0] * (n_kernels))
import matplotlib.pyplot as plt
for optimize_log_dynamic in model_by_logdynamic:
    model = model_by_logdynamic[optimize_log_dynamic]
    print(optimize_log_dynamic)
    from matplotlib import rcParams
    rcParams['figure.figsize'] = 20, 5
    rcParams['figure.dpi'] = 100
    mb.pl.logo(model, n_cols=3, show=True, n_rows=6, stop_at=4) #  log=True)
    plt.show()
False
break

True
break

for optimize_log_dynamic in model_by_logdynamic:
if not optimize_log_dynamic:
continue
model = model_by_logdynamic[optimize_log_dynamic]
print(optimize_log_dynamic)
tsum = torch.sum
texp = torch.exp
tspa = torch.sparse_coo_tensor
tsmm = torch.sparse.mm
t = torch.transpose
# connectivities
C = model.graph_module.conn_sparse
a_ind = C.indices()
log_dynamic = model.graph_module.log_dynamic
D = model.graph_module.log_dynamic
D_tril = tspa(a_ind, D, C.shape) # .requires_grad_(True).cuda()
D_triu = tspa(a_ind, -D, C.shape) # .requires_grad_(True).cuda()
D = D_tril + t(D_triu, 0, 1)
# log_dynamic = log_dynamic + -torch.transpose(log_dynamic, 0, 1)
# triu_indices = torch.triu_indices(row=n_rounds, col=n_rounds, offset=1)
D
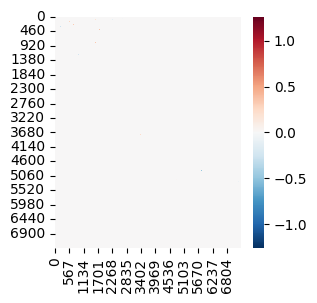
import seaborn as sns
mb.pl.set_rcParams({'figure.figsize': [3, 3]})
sns.heatmap(D.to_dense().detach().cpu(), cmap='RdBu_r')
plt.show()
True
model = model_by_logdynamic[1]
D
tensor(indices=tensor([[   0,    0,    0,  ..., 6906, 6980, 7289],
                       [   1,  251,  289,  ..., 7358, 7358, 7358]]),
       values=tensor([ 0.1255,  0.5133,  0.5014,  ..., -0.5014, -0.5014,
                      -0.5014]),
       device='cuda:0', size=(7359, 7359), nnz=280548, layout=torch.sparse_coo,
       grad_fn=<AddBackward0>)
pwd
'/home/ilibarra/workspace/theislab/mubind/docs/notebooks/single_cell'
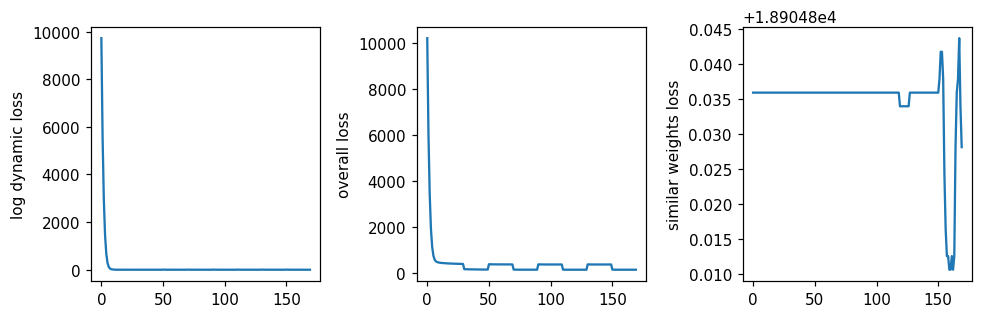
mb.pl.set_rcParams({'figure.figsize': [12, 3], 'figure.dpi': 110})
plt.subplot(1, 4, 1)
plt.plot(model.loss_history_log_dynamic)
plt.ylabel('log dynamic loss')
plt.subplot(1, 4, 2)
plt.plot(model.loss_history)
plt.ylabel('overall loss')
plt.subplot(1, 4, 3)
plt.plot(model.loss_history_sym_weights)
plt.ylabel('similar weights loss')
plt.tight_layout()

plt.savefig('losses_noack.pdf')
plt.show()
!readlink -f losses.pdf
/home/ilibarra/workspace/theislab/mubind/docs/notebooks/single_cell/losses.pdf
import pandas as pd
import numpy as np
rcParams['figure.figsize'] = 3, 5
r2_all = []
for optimize_log_dynamic in model_by_logdynamic:
print(optimize_log_dynamic)
model = model_by_logdynamic[optimize_log_dynamic]
# contributions per newly added kernel
import seaborn as sns
if len(model.best_r2_by_new_filter) != 0:
r2 = pd.DataFrame(model.best_r2_by_new_filter, columns=['r2']).reset_index()
r2['opt_log_dynamic'] = optimize_log_dynamic
r2_all.append(r2)
if len(r2_all) > 0:
r2_all = pd.concat(r2_all)
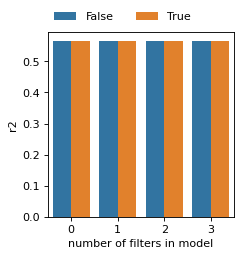
rcParams['figure.figsize'] = 3, 3
rcParams['figure.dpi'] = 80
ax = sns.barplot(data=r2_all, x='index', y='r2', hue='opt_log_dynamic', )
sns.move_legend(ax, "lower center", bbox_to_anchor=(.4, 1), ncol=3, title=None, frameon=False)
plt.xlabel('number of filters in model')
plt.show()
False
True
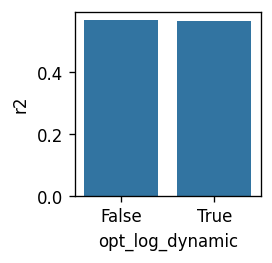
rcParams['figure.dpi'] = 120
rcParams['figure.figsize'] = 2, 2
df = r2_all.sort_values('index', ascending=False).groupby('opt_log_dynamic').head(1)
print(df)
sns.barplot(df, y='r2', x='opt_log_dynamic')
   index        r2  opt_log_dynamic
3      3  0.566473            False
3      3  0.564373             True
<Axes: xlabel='opt_log_dynamic', ylabel='r2'>
model = model_by_logdynamic[True]
torch.set_printoptions(precision=2)
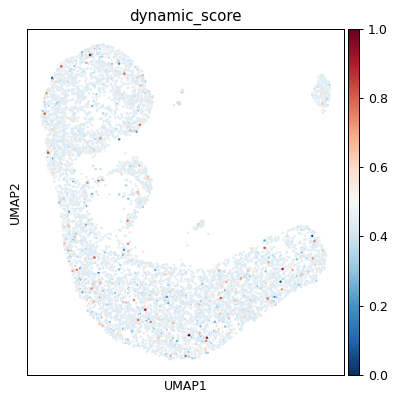
dynamic_score = D.to_dense().detach().cpu().sum(axis=0)
# dyn_score
dynamic_score = dynamic_score
dynamic_score = (dynamic_score - dynamic_score.min()) / (dynamic_score.max() - dynamic_score.min())
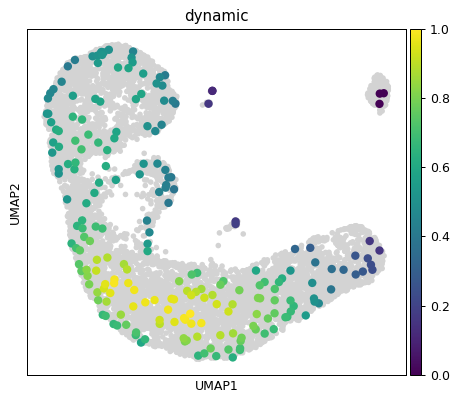
ad.obs['dynamic_score'] = dynamic_score
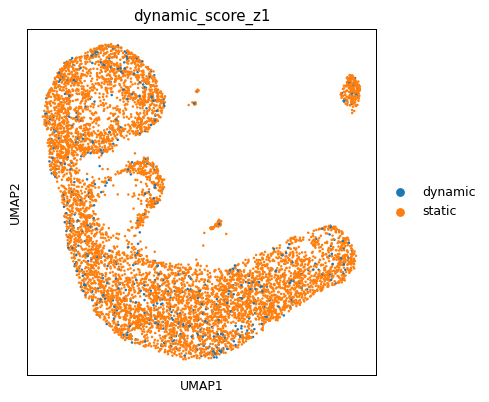
ad.obs['dynamic_score_cluster'] = np.where(dynamic_score > dynamic_score.mean(), 'dynamic', 'static')
z1 = np.where(((dynamic_score - dynamic_score.mean()) / dynamic_score.std()) > 1, 'dynamic', 'static')
z2 = np.where(((dynamic_score - dynamic_score.mean()) / dynamic_score.std()) > 2, 'dynamic', 'static')
ad.obs['dynamic_score_z1'] = z1
ad.obs['dynamic_score_z2'] = z2
ad.obs['dynamic_score'].describe()
count    7359.000000
mean        0.438135
std         0.054474
min         0.000000
25%         0.438130
50%         0.438135
75%         0.438140
max         1.000000
Name: dynamic_score, dtype: float64
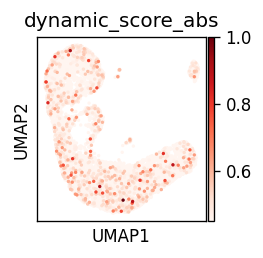
ad.obs['dynamic_score_abs'] = ad.obs['dynamic_score'].abs()
sc.pl.umap(ad, color='dynamic_score_abs', color_map='Reds', vmin=.45)
# contributions per newly added kernel
mb.pl.set_rcParams({'figure.figsize': [5, 5], 'figure.dpi': 90})
sc.pl.umap(ad, color=['dynamic_score'], cmap='RdBu_r', sort_order=True)
sc.pl.umap(ad, color=['dynamic_score_z1'], cmap='RdBu_r', sort_order=True)
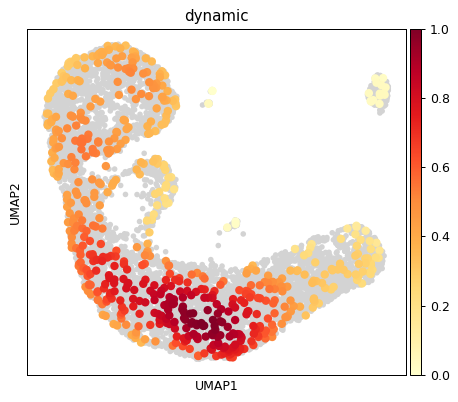
sc.tl.embedding_density(ad, basis='umap', groupby='dynamic_score_z1')
sc.pl.embedding_density(ad, basis='umap', key='umap_density_dynamic_score_z1', group='dynamic') # basis='umap', groupby='dynamic_score_cluster')
sc.tl.embedding_density(ad, basis='umap', groupby='dynamic_score_z2')
sc.pl.embedding_density(ad, basis='umap', key='umap_density_dynamic_score_z2', group='dynamic', color_map='viridis') # basis='umap', groupby='dynamic_score_cluster')
import seaborn as sns
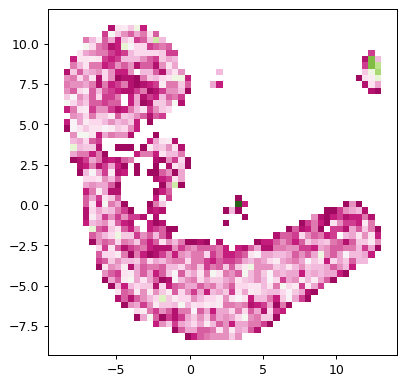
umap = ad.obsm['X_umap']
sns.histplot(x=umap[:, 0], y=umap[:, 1], bins=50, cmap='PiYG')
<Axes: >
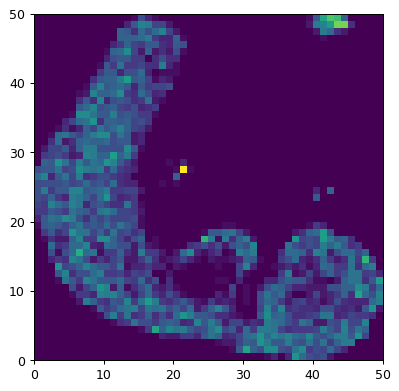
plt.pcolormesh(
    np.histogram2d(umap[:, 0], umap[:, 1], bins=50)[0]
)
<matplotlib.collections.QuadMesh at 0x7081774cf2b0>
x, y = np.meshgrid(umap[:, 0], umap[:, 1])
x = umap[:,1] # array_txt[:,0]
y = umap[:,1] # array_txt[:,1]
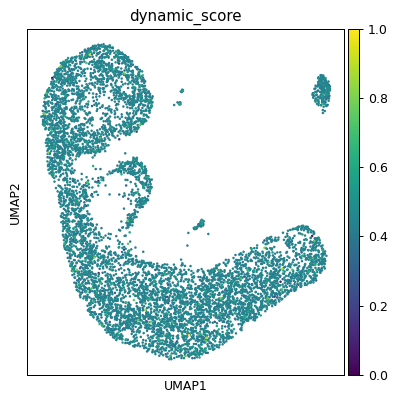
z = ad.obs['dynamic_score'].values # array_txt[:,2]
sc.pl.umap(ad, color='dynamic_score')
import matplotlib.pyplot as plt
import numpy as np
rcParams['figure.figsize'] = 5, 3
# generate 2 2d grids for the x & y bounds
y, x = np.meshgrid(np.linspace(-3, 3, 100), np.linspace(-3, 3, 100))
z = (1 - x / 2. + x ** 5 + y ** 3) * np.exp(-x ** 2 - y ** 2)
z = z[:-1, :-1]
z_min, z_max = -np.abs(z).max(), np.abs(z).max()
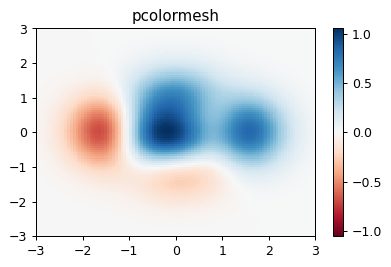
fig, ax = plt.subplots()
c = ax.pcolormesh(x, y, z, cmap='RdBu', vmin=z_min, vmax=z_max)
ax.set_title('pcolormesh')
# set the limits of the plot to the limits of the data
ax.axis([x.min(), x.max(), y.min(), y.max()])
fig.colorbar(c, ax=ax)
plt.show()
import itertools
import numpy as np

def grid(x, y, z, size_x=1, size_y=1):

    def pairwise(iterable):
        "s -> (s0,s1), (s1,s2), (s2, s3), ..."
        a, b = itertools.tee(iterable)
        next(b, None)
        return zip(a, b)

    minx, maxx = int(min(x)), int(max(x)) + 1
    miny, maxy = int(min(y)), int(max(y)) + 1

    result = []
    x_edges = pairwise(np.arange(minx, maxx + 1, size_x))
    for xleft, xright in x_edges:
        xmask = np.logical_and(x >= xleft, x < xright)
        y_edges = pairwise(np.arange(miny, maxy + 1, size_y))
        for yleft, yright in y_edges:
            ymask = np.logical_and(y >= yleft, y < yright)
            cell = z[np.logical_and(xmask, ymask)]
            result.append(cell.sum())

    result = np.array(result).reshape((maxx - minx, maxy - miny))
    return np.flip(result.T, 0)
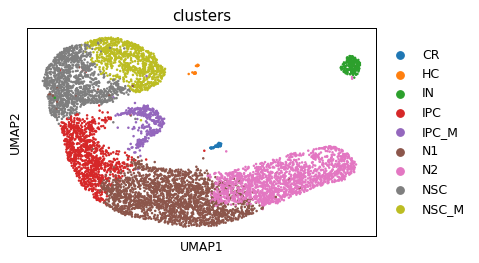
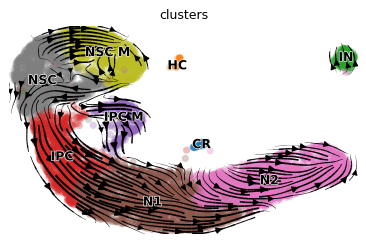
cell_type_key = 'clusters'
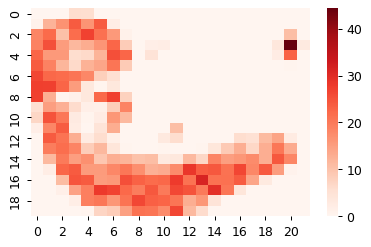
grid_dyn_score = grid(umap[:,0], umap[:,1], ad.obs['dynamic_score'], size_x=1, size_y=1)
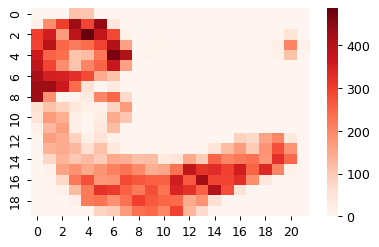
grid_counts = grid(umap[:,0], umap[:,1], ad.obs[cell_type_key].cat.codes.values, size_x=1, size_y=1)
sns.heatmap(grid_dyn_score, cmap='Reds')
plt.show()
sns.heatmap(grid_counts, cmap='Reds')
plt.show()

sc.pl.umap(ad, color=cell_type_key)
# for optimize_log_dynamic in model_by_logdynamic:
#     mb.pl.set_rcParams({'figure.figsize': [3, 3], 'figure.dpi': 90})
#     print(optimize_log_dynamic)
#     model = model_by_logdynamic[optimize_log_dynamic]
#     mb.pl.kmer_enrichment(model, train, log_scale=False, style='scatter', ylab='t1', xlab='p1', k=8)
#     plt.show()

#     mb.pl.set_rcParams({'figure.figsize': [10, 7], 'figure.dpi': 90})
#     mb.pl.logo(model,
#                title=False,
#                xticks=False,
#                rowspan_dinuc=0,
#                rowspan_mono=1,
#                n_rows=12,
#                n_cols=3,
#                stop_at=20) # n_cols=len(reduced_groups))
#     plt.show()
model = model_by_logdynamic[True]
G = model.graph_module.conn_sparse.detach().cpu().to_dense() # (C, C)
# number of non_zero weights
len(G[G != 0])
140274
# output = model(**inputs, use_conn=False, return_binding_scores=True)
print('here...')
here...
ad
AnnData object with n_obs × n_vars = 7359 × 1948
    obs: 'Clusters', '_X', '_Y', 'initial_size_unspliced', 'initial_size_spliced', 'initial_size', 'n_counts', 'louvain', 'clusters', 'velocity_self_transition', 'root_cells', 'end_points', 'velocity_pseudotime', 'latent_time', 'dynamic_score', 'dynamic_score_cluster', 'dynamic_score_z1', 'dynamic_score_z2', 'dynamic_score_abs', 'umap_density_dynamic_score_z1', 'umap_density_dynamic_score_z2'
    var: 'Accession', 'Chromosome', 'End', 'Start', 'Strand', 'means', 'dispersions', 'dispersions_norm', 'velocity_gamma', 'velocity_r2', 'velocity_genes', 'fit_alpha', 'fit_beta', 'fit_gamma', 'fit_t_', 'fit_scaling', 'fit_std_u', 'fit_std_s', 'fit_likelihood', 'fit_u0', 'fit_s0', 'fit_pval_steady', 'fit_steady_u', 'fit_steady_s', 'fit_alignment_scaling', 'chrom', 'pos', 'strand', 'tss_start', 'tss_end', 'chromosome_name', 'k', 'acc_score', 'acc_score_rank', 'chr', 'summit.start', 'summit.end', 'k.summit'
    uns: 'clusters_colors', 'louvain', 'louvain_colors', 'neighbors', 'pca', 'recover_dynamics', 'velocity_graph', 'velocity_graph_neg', 'velocity_settings', 'dynamic_score_z1_colors', 'umap_density_dynamic_score_z1_params', 'umap_density_dynamic_score_z2_params'
    obsm: 'X_pca', 'X_umap', 'velocity_umap'
    varm: 'PCs', 'loss'
    layers: 'Ms', 'Mu', 'ambiguous', 'fit_t', 'fit_tau', 'fit_tau_', 'matrix', 'spliced', 'unspliced', 'variance_velocity', 'velocity', 'velocity_u'
    obsp: 'connectivities', 'distances'
model = model.cuda()
device = torch.device("cuda:0" if torch.cuda.is_available() else "cpu")
# device = 'cpu'
# device
pwd
'/home/ilibarra/workspace/theislab/mubind/docs/notebooks/single_cell'
train.batch_size
256
for optimize_log_dynamic in model_by_logdynamic:
    print(optimize_log_dynamic)
    if not optimize_log_dynamic:
        continue
    model = model_by_logdynamic[optimize_log_dynamic].cuda()
    umap = ad.obsm['X_umap'].copy()
    umap = np.sort(umap, 0)

    x = umap[:,0]
    y = umap[:,1]
    X, Y = np.meshgrid(x, y)

    n_points = x.shape[0]
    # x-component to the right
    u = np.ones((n_points, n_points))
    # y-component zero
    v = np.zeros((n_points, n_points))

    pred = []
    for i, batch in enumerate(train):
        # Get a batch and potentially send it to GPU memory.
        mononuc = batch["mononuc"].to(device)
        # print(i, mononuc.shape)
        b = batch["batch"].to(device) if "batch" in batch else None
        rounds = batch["rounds"].to(device) if "rounds" in batch else None
        countsum = batch["countsum"].to(device) if "countsum" in batch else None
        seq = batch["seq"] if "seq" in batch else None
        residues = batch["residues"].to(device) if "residues" in batch else None
        if residues is not None and train.dataset.store_rev:
            mononuc_rev = batch["mononuc_rev"].to(device)
            inputs = {"mono": mononuc, "mono_rev": mononuc_rev, "batch": b, "countsum": countsum,
                      "residues": residues}
        elif residues is not None:
            inputs = {"mono": mononuc, "batch": b, "countsum": countsum, "residues": residues}
        elif train.dataset.store_rev:
            mononuc_rev = batch["mononuc_rev"].to(device)
            inputs = {"mono": mononuc, "mono_rev": mononuc_rev, "batch": b, "countsum": countsum}
        else:
            inputs = {"mono": mononuc, "batch": b, "countsum": countsum}

        inputs['scale_countsum'] = model.datatype == 'selex'


        output = model(**inputs, use_conn=False, return_binding_scores=True)

        output = output.cpu().detach().numpy()
        print('here...')
        print(output.shape)

        print(output.sum())
        pred.append(output)

    # pred = np.concatenate(pred).T

    binding_scores = np.concatenate(pred).T


    # ad.layers['velocity'] = pred

    # conn = model.graph_module.conn_sparse.detach().cpu()
    # conn = model.graph_module.conn_sparse.detach().cpu().to_dense()
    # v = conn.sum(axis=1)
    # ad.layers['velocity'] = torch.stack([v,] * ad.shape[1], axis=1).numpy()

    # ad.layers['counts'] = ad.X

    # mb.pl.set_rcParams({'figure.figsize': [5, 4], 'figure.dpi': 90})
    # plt.hist(model.graph_module.conn_sparse.values().detach().cpu().numpy())
    # plt.show()

    # import scvelo as scv

    # sc.pp.neighbors(ad)

    # # scv.tl.velocity_graph(ad, vkey='velocity', xkey='counts')
    # # ad.layers['velocity'] = ad.obs['dynamic_score']

    # scv.tl.velocity_graph(ad, vkey='velocity', xkey='counts')
    # ax = scv.pl.velocity_embedding_stream(ad, color='celltype', show=False) #  X_grid='X_umap', V=V)


X = ad.X.A
G @ binding_scores
np.random.shuffle(binding_scores)
False
True
here...
(256, 7359)
4055290300000.0
here...
(256, 7359)
6317207000000.0
here...
(256, 7359)
5242914000000.0
here...
(256, 7359)
4033818400000.0
here...
(256, 7359)
4542154400000.0
here...
(256, 7359)
3474303200000.0
here...
(256, 7359)
5099480400000.0
here...
(156, 7359)
3765126000000.0
import scvelo as scv
ad.shape, binding_scores.shape
((7359, 1948), (7359, 1948))
ad
ad.layers['velocity'] = binding_scores
# scv.tl.velocity_graph(ad, vkey='velocity', xkey='counts')
# ax = scv.pl.velocity_embedding_stream(ad, color='celltype', show=False) #  X_grid='X_umap', V=V)
np.random.shuffle(binding_scores)
binding_scores
array([[1742439. , 1966243.4, 1944581.6, ..., 2549281.2, 3346296. ,
        2905771. ],
       [1742382.1, 1966200.1, 1944551.4, ..., 2549803. , 3347279.8,
        2906606.5],
       [1742469.6, 1966290.5, 1944630.9, ..., 2549936.2, 3347304.5,
        2906533. ],
       ...,
       [1742390.1, 1966195.9, 1944579. , ..., 2550213. , 3347730.2,
        2906630.8],
       [1742391.9, 1966217.2, 1944551.1, ..., 2550047. , 3347594.2,
        2906810.8],
       [1742527.1, 1966385.2, 1944695.5, ..., 2549845.2, 3347059. ,
        2905971. ]], dtype=float32)
try:
    scv.pl.velocity_embedding_stream(rna_sample, color=cell_type_key)
except Exception:
    print("sample too small.")
# np.random.shuffle(binding_scores)
# ad.layers['velocity'] = binding_scores
# scv.tl.velocity_graph(ad, vkey='velocity', xkey='counts')
# ax = scv.pl.velocity_embedding_stream(ad, color='celltype', show=False) #  X_grid='X_umap', V=V)
# model_by_log
import seaborn as sns
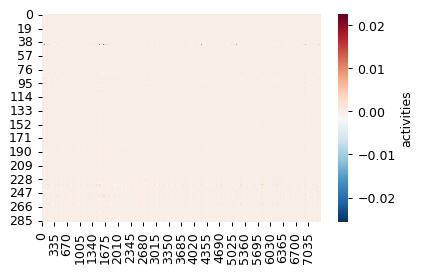
act_on = model_by_logdynamic[True].get_log_activities().detach().cpu().squeeze(0)
act_off = model_by_logdynamic[False].get_log_activities().detach().cpu().squeeze(0)
sns.heatmap(act_on, cmap='RdBu_r', cbar_kws={'label': 'activities'})
<Axes: >
# # highlight the top-n filters per cell, with the top variability
# rcParams['figure.dpi'] = 100
# n_show = 15
# print(act.var(axis=1).sort()[1][-n_show:])
# act_sel = act[act.var(axis=1).sort()[1][-n_show:],:]
# vmax = act_sel.abs().max()
# sns.clustermap(act_sel,
#                vmin=-vmax / 2, vmax=vmax / 2,
#                cmap='RdBu_r',

#                cbar_kws={'label': 'activities'},
#                figsize=[5, 3])
# rna_sample.layers['velocity'].shape, rna_sample.shape
# scv.pl.velocity_graph(rna_sample)
# ax = scv.pl.velocity_embedding_stream(ad,
#                                       color='celltype',
#                                       # density=2,
#                                       arrow_color='black',
#                                       n_neighbors=15) # show=False) #  X_grid='X_umap', V=V)
# ax = scv.pl.velocity_embedding_stream(ad, color='celltype', density=2, arrow_color='black', n_neighbors=15) # show=False) # X_grid='X_umap', V=V)
# scv.pl.velocity_embedding_stream(ad, color='celltype', n_neighbors=15) # X_grid='X_umap', V=V)
Study the asssociations betweeen obtained weights and cluster-specific transcription factors
Load information from archetypes DB (Vierstra et al 2020)
rna_sample, ad.shape
(AnnData object with n_obs × n_vars = 7359 × 1948
     obs: 'Clusters', '_X', '_Y', 'initial_size_unspliced', 'initial_size_spliced', 'initial_size', 'n_counts', 'louvain', 'clusters', 'velocity_self_transition', 'root_cells', 'end_points', 'velocity_pseudotime', 'latent_time', 'dynamic_score', 'dynamic_score_cluster', 'dynamic_score_z1', 'dynamic_score_z2', 'dynamic_score_abs', 'umap_density_dynamic_score_z1', 'umap_density_dynamic_score_z2'
     var: 'Accession', 'Chromosome', 'End', 'Start', 'Strand', 'means', 'dispersions', 'dispersions_norm', 'velocity_gamma', 'velocity_r2', 'velocity_genes', 'fit_alpha', 'fit_beta', 'fit_gamma', 'fit_t_', 'fit_scaling', 'fit_std_u', 'fit_std_s', 'fit_likelihood', 'fit_u0', 'fit_s0', 'fit_pval_steady', 'fit_steady_u', 'fit_steady_s', 'fit_alignment_scaling', 'chrom', 'pos', 'strand', 'tss_start', 'tss_end', 'chromosome_name', 'k', 'acc_score', 'acc_score_rank', 'chr', 'summit.start', 'summit.end', 'k.summit'
     uns: 'clusters_colors', 'louvain', 'louvain_colors', 'neighbors', 'pca', 'recover_dynamics', 'velocity_graph', 'velocity_graph_neg', 'velocity_settings', 'dynamic_score_z1_colors', 'umap_density_dynamic_score_z1_params', 'umap_density_dynamic_score_z2_params'
     obsm: 'X_pca', 'X_umap', 'velocity_umap'
     varm: 'PCs', 'loss'
     layers: 'Ms', 'Mu', 'ambiguous', 'fit_t', 'fit_tau', 'fit_tau_', 'matrix', 'spliced', 'unspliced', 'variance_velocity', 'velocity', 'velocity_u'
     obsp: 'connectivities', 'distances',
 (7359, 1948))
rna_sel = rna_sample # rna[rna.obs_names.isin(ad.obs_names),:].copy()
rna_sel.shape
(7359, 1948)
pwd
'/home/ilibarra/workspace/theislab/mubind/docs/notebooks/single_cell'
import bindome as bd
bd.constants.ANNOTATIONS_DIRECTORY = 'annotations'

anno = mb.datasets.archetypes_anno()
rna_sel.shape
anno.sort_values('Cluster_ID')
| Cluster_ID | Name | DBD | Seed_motif | Total_width | Consensus_left | Consensus_right | Cluster_size | |
|---|---|---|---|---|---|---|---|---|
| 61 | 1 | HD/1 | homeodomain | LHX6_homeodomain_3 | 12 | 0 | 12 | 2 |
| 72 | 2 | HD/2 | homeodomain | ALX3_MA0634.1 | 26 | 8 | 16 | 186 |
| 79 | 3 | HD/3 | homeodomain | VENTX_homeodomain_2 | 21 | 3 | 20 | 1 |
| 80 | 4 | HD/4 | homeodomain | BARX1_MOUSE.H11MO.0.C | 17 | 5 | 13 | 17 |
| 81 | 5 | HD/5 | homeodomain | BARX1_homeodomain_1 | 21 | 2 | 18 | 6 |
| ... | ... | ... | ... | ... | ... | ... | ... | ... |
| 163 | 282 | PAX/2 | PAX | PAX5_HUMAN.H11MO.0.A | 24 | 4 | 21 | 3 |
| 161 | 283 | PAX-halfsite | PAX | Pax2_MA0067.1 | 8 | 1 | 7 | 1 |
| 0 | 284 | AHR | bHLH | AHR_HUMAN.H11MO.0.B | 9 | 2 | 8 | 3 |
| 105 | 285 | KLF/SP/3 | C2H2 | KLF8_HUMAN.H11MO.0.C | 9 | 0 | 9 | 2 |
| 285 | 286 | ZSCAN4 | C2H2 | ZSCAN4_C2H2_1 | 15 | 1 | 14 | 2 |
286 rows × 8 columns
print('here...')
here...
for optimize_log_dynamic in model_by_logdynamic:
print(optimize_log_dynamic)
model = model_by_logdynamic[optimize_log_dynamic]
log_act = torch.stack(list(model.activities.log_activities), dim=1).squeeze(0)
log_act = pd.DataFrame(log_act.detach().cpu().numpy())
# log_act.columns = anno['Seed_motif'][2]
# log_act.columns = ['intercept', 'dinuc_bias'] + list(anno['Seed_motif'].values)
log_act.index = ad.obs_names
ad.obsm['mubind_activities'] = log_act
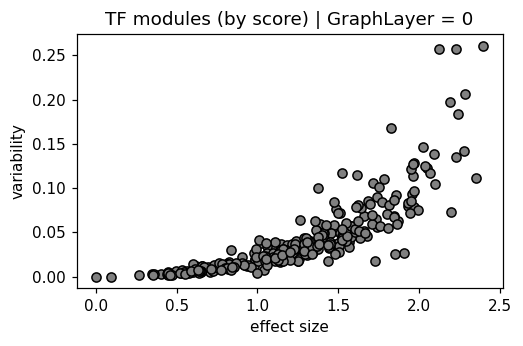
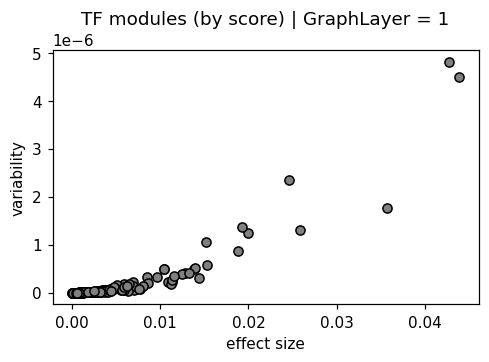
mb.pl.set_rcParams({'figure.figsize': [5, 3], 'figure.dpi': 110})
delta = (log_act.max(axis=0) - log_act.min(axis=0))
var = log_act.var(axis=0)
plt.scatter(delta, var, color='gray', edgecolors='black')
plt.xlabel('effect size')
plt.ylabel('variability')
plt.title('TF modules (by score) | GraphLayer = %i' % optimize_log_dynamic )
plt.show()
False
True
# unique names for annotation
names = anno['Name'] # .sort_values('Name')
added = dict()
new_name = []
for name in names:
    if not name in added:
        new_name.append(name)
        added[name] = 0
    else:
        new_name.append(name + '_%i' % added[name])
        added[name] += 1
anno['Name_unique'] = new_name
from scipy.stats import spearmanr
res = []
for optimize_log_dynamic in model_by_logdynamic:
if not optimize_log_dynamic:
continue
model = model_by_logdynamic[optimize_log_dynamic]
log_act = torch.stack(list(model.activities.log_activities), dim=1).squeeze(0)
log_act = pd.DataFrame(log_act.detach().cpu().numpy())
# log_act.columns = anno['Seed_motif'][2]
log_act.columns = ['intercept', 'dinuc_bias'] + list(range(1, 287))
log_act.index = ad.obs_names
ad.obsm['mubind_activities'] = log_act
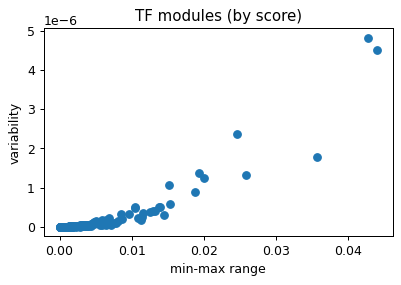
mb.pl.set_rcParams({'figure.figsize': [5, 3], 'figure.dpi': 90})
delta = (log_act.max(axis=0) - log_act.min(axis=0))
var = log_act.var(axis=0)
plt.scatter(delta, var)
plt.xlabel('min-max range')
plt.ylabel('variability')
plt.title('TF modules (by score)')
plt.show()
for c in log_act:
a = log_act[c]
b = ad.obs['dynamic_score'].values
# print(a.shape, b.shape)
res.append([optimize_log_dynamic, c] + list(spearmanr(a, b)))
res = pd.DataFrame(res, columns=['opt_log_dynamic', 'archetype_id', 'spearman', 'p_val'])
# add archetypes name
meta = pd.DataFrame(pd.concat([delta, var], axis=1))
meta.columns = ['max_effect', 'variability']
meta['name'] = ['intercept', 'dinuc_bias'] + list(range(1, 287))
clu = mb.datasets.archetypes_clu()
meta['archetypes_name'] = meta['name'].map(anno.set_index('Cluster_ID')['Name_unique'])
meta['archetypes_name'] = np.where(pd.isnull(meta['archetypes_name']), meta['name'], meta['archetypes_name'])

meta['archetypes_seed'] = meta['name'].map(anno.set_index('Cluster_ID')['Seed_motif'])

meta['filter_position'] = range(0, meta.shape[0])
meta = meta.sort_values('max_effect', ascending=0)
meta

res = res.merge(meta, left_on='archetype_id', right_on='name')
res = res.sort_values('p_val', ascending=True)
name_by_filter_id = meta['archetypes_name'].to_dict()
# name_by_filter_id
Observe general scores per case
res
| opt_log_dynamic | archetype_id | spearman | p_val | max_effect | variability | name | archetypes_name | archetypes_seed | filter_position | |
|---|---|---|---|---|---|---|---|---|---|---|
| 103 | True | 102 | 0.139282 | 3.355112e-33 | 0.003247 | 2.366894e-08 | 102 | NFAT/3 | NFATC1_NFAT_2 | 103 |
| 126 | True | 125 | 0.138437 | 8.133633e-33 | 0.001896 | 6.688103e-09 | 125 | SMARCA5 | SMCA5_HUMAN.H11MO.0.C | 126 |
| 166 | True | 165 | -0.134058 | 7.351971e-31 | 0.003608 | 2.721062e-08 | 165 | RBPJ | RBPJ_MA1116.1 | 166 |
| 18 | True | 17 | -0.129317 | 8.166232e-29 | 0.005969 | 6.380463e-08 | 17 | CUX/4 | CUX2_MOUSE.H11MO.0.C | 18 |
| 63 | True | 62 | 0.124271 | 1.015061e-26 | 0.000796 | 1.534651e-09 | 62 | Ebox/CATATG | Atoh1.mouse_bHLH_1 | 63 |
| ... | ... | ... | ... | ... | ... | ... | ... | ... | ... | ... |
| 181 | True | 180 | 0.003626 | 7.557977e-01 | 0.002967 | 2.802784e-08 | 180 | SIX/1 | SIX1_HUMAN.H11MO.0.A | 181 |
| 177 | True | 176 | 0.003364 | 7.729420e-01 | 0.000338 | 8.948248e-11 | 176 | PRDM16 | PRD16_MOUSE.H11MO.0.B | 177 |
| 133 | True | 132 | -0.001165 | 9.203964e-01 | 0.001180 | 2.442504e-09 | 132 | THAP1 | THAP1_MA0597.1 | 133 |
| 170 | True | 169 | -0.000909 | 9.378249e-01 | 0.003005 | 1.881324e-08 | 169 | BCL6/1 | BCL6B_C2H2_1 | 170 |
| 51 | True | 50 | 0.000594 | 9.594010e-01 | 0.001429 | 7.456526e-09 | 50 | CREB/ATF/2 | ATF7_MA0834.1 | 51 |
288 rows × 10 columns
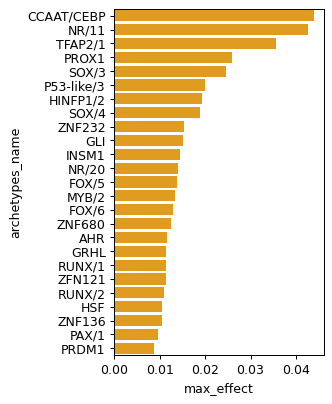
rcParams['figure.figsize'] =3, 5
sns.barplot(data=res.sort_values('max_effect', ascending=False).head(25), x='max_effect', y='archetypes_name', color='orange')
<Axes: xlabel='max_effect', ylabel='archetypes_name'>
res
| opt_log_dynamic | archetype_id | spearman | p_val | max_effect | variability | name | archetypes_name | archetypes_seed | filter_position | |
|---|---|---|---|---|---|---|---|---|---|---|
| 103 | True | 102 | 0.139282 | 3.355112e-33 | 0.003247 | 2.366894e-08 | 102 | NFAT/3 | NFATC1_NFAT_2 | 103 |
| 126 | True | 125 | 0.138437 | 8.133633e-33 | 0.001896 | 6.688103e-09 | 125 | SMARCA5 | SMCA5_HUMAN.H11MO.0.C | 126 |
| 166 | True | 165 | -0.134058 | 7.351971e-31 | 0.003608 | 2.721062e-08 | 165 | RBPJ | RBPJ_MA1116.1 | 166 |
| 18 | True | 17 | -0.129317 | 8.166232e-29 | 0.005969 | 6.380463e-08 | 17 | CUX/4 | CUX2_MOUSE.H11MO.0.C | 18 |
| 63 | True | 62 | 0.124271 | 1.015061e-26 | 0.000796 | 1.534651e-09 | 62 | Ebox/CATATG | Atoh1.mouse_bHLH_1 | 63 |
| ... | ... | ... | ... | ... | ... | ... | ... | ... | ... | ... |
| 181 | True | 180 | 0.003626 | 7.557977e-01 | 0.002967 | 2.802784e-08 | 180 | SIX/1 | SIX1_HUMAN.H11MO.0.A | 181 |
| 177 | True | 176 | 0.003364 | 7.729420e-01 | 0.000338 | 8.948248e-11 | 176 | PRDM16 | PRD16_MOUSE.H11MO.0.B | 177 |
| 133 | True | 132 | -0.001165 | 9.203964e-01 | 0.001180 | 2.442504e-09 | 132 | THAP1 | THAP1_MA0597.1 | 133 |
| 170 | True | 169 | -0.000909 | 9.378249e-01 | 0.003005 | 1.881324e-08 | 169 | BCL6/1 | BCL6B_C2H2_1 | 170 |
| 51 | True | 50 | 0.000594 | 9.594010e-01 | 0.001429 | 7.456526e-09 | 50 | CREB/ATF/2 | ATF7_MA0834.1 | 51 |
288 rows × 10 columns
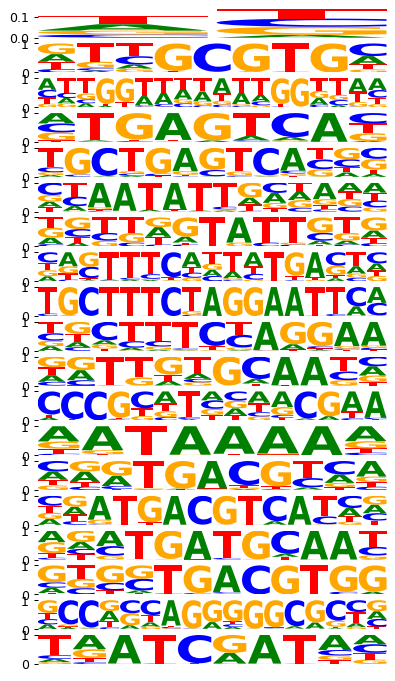
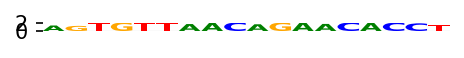
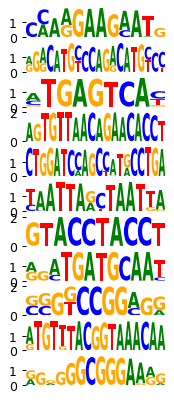
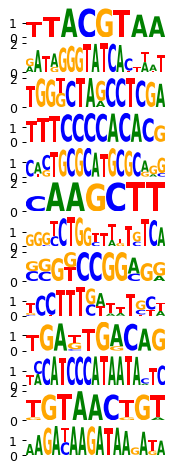
# visualize the logos as obtained by the model in each step
mb.pl.set_rcParams({'figure.figsize': [5, 20], 'figure.dpi': 90})
mb.pl.logo(model, title=False, xticks=False, rowspan_dinuc=0, rowspan_mono=1, n_rows=40, n_cols=1, stop_at=20)
           # n_rows=len(res.head(20).index),
break
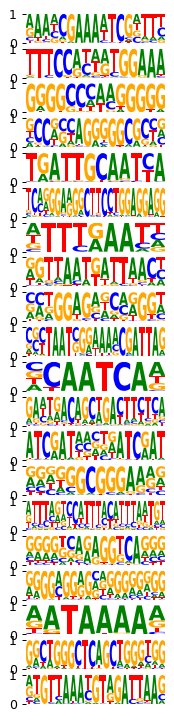
mb.pl.set_rcParams({'figure.figsize': [2, 20], 'figure.dpi': 90})
mb.pl.logo(model, title=False, xticks=False, rowspan_dinuc=0, rowspan_mono=1, n_rows=40,
           # n_rows=len(res.head(20).index),
           n_cols=1, order=res.head(20).index) # n_cols=len(reduced_groups))
plt.tight_layout()
plt.show()
<Figure size 180x1800 with 0 Axes>
import resource
print('total GB used:', resource.getrusage(resource.RUSAGE_SELF).ru_maxrss / 1e6)
total GB used: 6.952268
# for k in ad.obsm['log_activities'].iloc[:,2:]:
#     ad.obs[str(k)] = ad.obsm['log_activities'][k]
# sc.pl.umap(ad, color=map(str, ad.obsm['log_activities'].iloc[:,2:]), cmap='Reds')
rna_sel.obsm['X_umap'] = ad.obsm['X_umap']
vars_mapper = {}
def find_varname(ad, k, shuffle=False, ):
    if not shuffle:
        if k in vars_mapper:
            return vars_mapper[k]
        else:
            result = ad.var_names[ad.var_names.str.upper().str.startswith(k.upper())]
            vars_mapper[k] = result
            return result
    else:
        ad_sel = ad.var_names[ad.var_names.str.upper().str.startswith(k.upper())]
        return pd.Series(ad.var_names).sample(ad_sel.shape[0]).values
from scipy.stats import spearmanr, pearsonr
Calculate global correlations between the activities obtained per motif and gene-specific expression
all_targets = set()
for optimize_log_dynamic in model_by_logdynamic:
    print(optimize_log_dynamic)
    model = model_by_logdynamic[optimize_log_dynamic]

    log_act = torch.stack(list(model.activities.log_activities), dim=1).squeeze(0)
    log_act = pd.DataFrame(log_act.detach().cpu().numpy())
    log_act.index = ad.obs_names

    ad.obsm['log_activities'] = log_act
    ad.obsm['log_activities'].columns = ['intercept', 'dinuc_bias'] + list(range(1, 287))

    # collect all targets
    for k in ad.obsm['log_activities'].iloc[:,2:]:
        log_act = ad.obsm['log_activities'][k].values
        names = set()
        clu_sel = clu[clu['Cluster_ID'] == k]['Motif']
        for g in clu_sel:
            names.add(g.split('_')[0].split('.')[0].split('+')[0].upper())
        for g in anno[anno['Cluster_ID'] == k]['Seed_motif']:
            names.add(g.split('_')[0].split('.')[0])
        # print(k, names)
        targets = set()
        for name in names:
            target = find_varname(rna_sel, name)
            for t in target:
                all_targets.add(t)
        if len(targets) > 0 and False:
            sc.pl.umap(rna_sel, color=targets, cmap='Reds')
False
True
def get_act_gene_corr(model_by_logdynamic, shuffle=False, random_state=0):
    print('association between motif activities and related TF targets (shuffle = %i)' % shuffle)
    res = []
    # print(len(all_targets))

    rna_sel_df = rna_sel.to_df()

    for optimize_log_dynamic in model_by_logdynamic:
        print('use GraphLayer = %i' % optimize_log_dynamic)
        model = model_by_logdynamic[optimize_log_dynamic]

        log_act = torch.stack(list(model.activities.log_activities), dim=1).squeeze(0)
        log_act = pd.DataFrame(log_act.detach().cpu().numpy())
        log_act.index = ad.obs_names

        ad.obsm['log_activities'] = log_act
        ad.obsm['log_activities'].columns = ['intercept', 'dinuc_bias'] + list(range(1, 287))

        if shuffle:
            random_cols = ad.obsm['log_activities'].iloc[:,2:].columns.values
            np.random.shuffle(random_cols)
            # random_cols

        for ki, k in enumerate(ad.obsm['log_activities'].iloc[:,2:]):
            next_log_act = ad.obsm['log_activities'][k].values

            # if shuffle:
            #     next_log_act = ad.obsm['log_activities'][random_cols[ki]].values

            # print(ki)
            # if ki % 30 == 0:
            #     print(ki)
            names = set()
            clu_sel = clu[clu['Cluster_ID'] == k]['Motif']
            for g in clu_sel:
                names.add(g.split('_')[0].split('.')[0].split('+')[0].upper())
            for g in anno[anno['Cluster_ID'] == k]['Seed_motif']:
                names.add(g.split('_')[0].split('.')[0])
            # print(k, names)
            next_targets = set()
            for name in names:
                target = find_varname(rna_sel, name, shuffle=shuffle)
                # print(name, target)
                for t in target:
                    next_targets.add(t)

            # for t in all_targets:
            for t in set(all_targets).intersection(next_targets):
                gex = rna_sel_df[[t]].to_numpy() # rna_sel_df[t].A
                assert gex.shape[1] == 1
                gex = gex.flatten()
                # print(next_log_act.shape, gex.shape)
                # print(t, pearsonr(next_log_act, gex))
                res.append([ki, optimize_log_dynamic, k, t, t in next_targets] +
                        list(spearmanr(next_log_act, gex)))

    res = pd.DataFrame(res, columns=['filter_id', 'opt_log_dynamic', 'archetype_id', 'gene_name', 'matched', 'spearman', 'p_val'])

    # p-values
    res['module_name'] = res['archetype_id'].map(anno.set_index('Cluster_ID')['Name'].to_dict())
    res['p_val'] = np.where(pd.isnull(res['p_val']), 1.0, res['p_val'])

    # p-val adjust
    from statsmodels.stats.multitest import fdrcorrection
    res['p_adj'] = fdrcorrection(res['p_val'])[1]
    return res
%load_ext line_profiler
The line_profiler extension is already loaded. To reload it, use:
  %reload_ext line_profiler
%lprun -f get_act_gene_corr get_act_gene_corr(model_by_logdynamic, shuffle=0)
association between motif activities and related TF targets (shuffle = 0)
use GraphLayer = 0
use GraphLayer = 1
Timer unit: 1e-09 s

Total time: 1.51881 s
File: /tmp/ipykernel_24341/1219755437.py
Function: get_act_gene_corr at line 1

Line #      Hits         Time  Per Hit   % Time  Line Contents
==============================================================
     1                                           def get_act_gene_corr(model_by_logdynamic, shuffle=False, random_state=0):
     2         1     182188.0 182188.0      0.0      print('association between motif activities and related TF targets (shuffle = %i)' % shuffle)
     3         1        524.0    524.0      0.0      res = []
     4                                               # print(len(all_targets))
     5
     6         1   24576172.0    2e+07      1.6      rna_sel_df = rna_sel.to_df()
     7
     8         3       2161.0    720.3      0.0      for optimize_log_dynamic in model_by_logdynamic:
     9         2     122402.0  61201.0      0.0          print('use GraphLayer = %i' % optimize_log_dynamic)
    10         2        653.0    326.5      0.0          model = model_by_logdynamic[optimize_log_dynamic]
    11
    12         2     934309.0 467154.5      0.1          log_act = torch.stack(list(model.activities.log_activities), dim=1).squeeze(0)
    13         2    3995641.0    2e+06      0.3          log_act = pd.DataFrame(log_act.detach().cpu().numpy())
    14         2      30954.0  15477.0      0.0          log_act.index = ad.obs_names
    15
    16         2     443862.0 221931.0      0.0          ad.obsm['log_activities'] = log_act
    17         2     217634.0 108817.0      0.0          ad.obsm['log_activities'].columns = ['intercept', 'dinuc_bias'] + list(range(1, 287))
    18
    19         2        303.0    151.5      0.0          if shuffle:
    20                                                       random_cols = ad.obsm['log_activities'].iloc[:,2:].columns.values
    21                                                       np.random.shuffle(random_cols)
    22                                                       # random_cols
    23
    24       574     514886.0    897.0      0.0          for ki, k in enumerate(ad.obsm['log_activities'].iloc[:,2:]):
    25       572   16759059.0  29299.1      1.1              next_log_act = ad.obsm['log_activities'][k].values
    26
    27                                                       # if shuffle:
    28                                                       #     next_log_act = ad.obsm['log_activities'][random_cols[ki]].values
    29
    30                                                       # print(ki)
    31                                                       # if ki % 30 == 0:
    32                                                       #     print(ki)
    33       572     244805.0    428.0      0.0              names = set()
    34       572  114406283.0 200011.0      7.5              clu_sel = clu[clu['Cluster_ID'] == k]['Motif']
    35      4920    2321589.0    471.9      0.2              for g in clu_sel:
    36      4348    2313461.0    532.1      0.2                  names.add(g.split('_')[0].split('.')[0].split('+')[0].upper())
    37      1144  107471941.0  93944.0      7.1              for g in anno[anno['Cluster_ID'] == k]['Seed_motif']:
    38       572     506243.0    885.0      0.0                  names.add(g.split('_')[0].split('.')[0])
    39                                                       # print(k, names)
    40       572     231518.0    404.8      0.0              next_targets = set()
    41      2722     466815.0    171.5      0.0              for name in names:
    42      2150    1346522.0    626.3      0.1                  target = find_varname(rna_sel, name, shuffle=shuffle)
    43                                                           # print(name, target)
    44      2866    2447143.0    853.9      0.2                  for t in target:
    45       716     129145.0    180.4      0.0                      next_targets.add(t)
    46
    47                                                       # for t in all_targets:
    48      1272    3323482.0   2612.8      0.2              for t in set(all_targets).intersection(next_targets):
    49       700  230856588.0 329795.1     15.2                  gex = rna_sel_df[[t]].to_numpy() # rna_sel_df[t].A
    50       700     357233.0    510.3      0.0                  assert gex.shape[1] == 1
    51       700    2195914.0   3137.0      0.1                  gex = gex.flatten()
    52                                                           # print(next_log_act.shape, gex.shape)
    53                                                           # print(t, pearsonr(next_log_act, gex))
    54      1400     726879.0    519.2      0.0                  res.append([ki, optimize_log_dynamic, k, t, t in next_targets] +
    55       700  994585303.0    1e+06     65.5                          list(spearmanr(next_log_act, gex)))
    56
    57         1     611219.0 611219.0      0.0      res = pd.DataFrame(res, columns=['filter_id', 'opt_log_dynamic', 'archetype_id', 'gene_name', 'matched', 'spearman', 'p_val'])
    58
    59                                               # p-values
    60         1     976655.0 976655.0      0.1      res['module_name'] = res['archetype_id'].map(anno.set_index('Cluster_ID')['Name'].to_dict())
    61         1     195127.0 195127.0      0.0      res['p_val'] = np.where(pd.isnull(res['p_val']), 1.0, res['p_val'])
    62
    63                                               # p-val adjust
    64         1    4911219.0    5e+06      0.3      from statsmodels.stats.multitest import fdrcorrection
    65         1     402807.0 402807.0      0.0      res['p_adj'] = fdrcorrection(res['p_val'])[1]
    66         1        120.0    120.0      0.0      return res
res = get_act_gene_corr(model_by_logdynamic)
shuffled = [get_act_gene_corr(model_by_logdynamic, shuffle=1, random_state=i) for i in range(10)]
association between motif activities and related TF targets (shuffle = 0)
use GraphLayer = 0
use GraphLayer = 1
association between motif activities and related TF targets (shuffle = 1)
use GraphLayer = 0
use GraphLayer = 1
association between motif activities and related TF targets (shuffle = 1)
use GraphLayer = 0
use GraphLayer = 1
association between motif activities and related TF targets (shuffle = 1)
use GraphLayer = 0
use GraphLayer = 1
association between motif activities and related TF targets (shuffle = 1)
use GraphLayer = 0
use GraphLayer = 1
association between motif activities and related TF targets (shuffle = 1)
use GraphLayer = 0
use GraphLayer = 1
association between motif activities and related TF targets (shuffle = 1)
use GraphLayer = 0
use GraphLayer = 1
association between motif activities and related TF targets (shuffle = 1)
use GraphLayer = 0
use GraphLayer = 1
association between motif activities and related TF targets (shuffle = 1)
use GraphLayer = 0
use GraphLayer = 1
association between motif activities and related TF targets (shuffle = 1)
use GraphLayer = 0
use GraphLayer = 1
association between motif activities and related TF targets (shuffle = 1)
use GraphLayer = 0
use GraphLayer = 1
table = []
for use_graph in [False, True]:
    for thr in range(1, 10):
        sel = res[res['opt_log_dynamic'] == use_graph]
        next_thr = 10 ** (-thr)
        n_pos = sel[sel['p_adj'] < next_thr].shape[0]
        n_neg = [s[(s['p_adj'] < next_thr) & (s['opt_log_dynamic'] == use_graph)].shape[0] for s in shuffled]
        # print(next_thr, n_pos, np.mean(n_neg), np.std(n_neg), (n_pos - np.mean(n_neg)) / np.std(n_neg))
        table.append([next_thr, n_pos, np.mean(n_neg), np.std(n_neg), (n_pos - np.mean(n_neg)) / np.std(n_neg), use_graph])
table = pd.DataFrame(table, columns=['p_adj_thr', 'n_pos', 'mu', 'sigma', 'zscore', 'graph_layer'])
table.pivot(index='graph_layer', columns='p_adj_thr', values='zscore')
| p_adj_thr | 1.000000e-09 | 1.000000e-08 | 1.000000e-07 | 1.000000e-06 | 1.000000e-05 | 1.000000e-04 | 1.000000e-03 | 1.000000e-02 | 1.000000e-01 |
|---|---|---|---|---|---|---|---|---|---|
| graph_layer | |||||||||
| False | 43.172477 | 42.862832 | 42.570044 | 42.494349 | 43.145921 | 43.046541 | 39.875000 | 39.599274 | 38.265423 |
| True | 18.032126 | 22.626105 | 20.713755 | 20.594524 | 22.479719 | 30.691892 | 36.402467 | 34.208363 | 42.635843 |
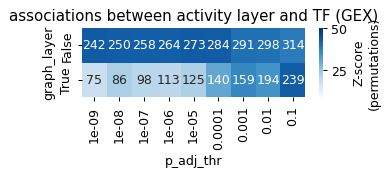
rcParams['figure.figsize'] = 4, 1
hm = table.pivot(index='graph_layer', columns='p_adj_thr', values='n_pos').fillna(0)
z = table.pivot(index='graph_layer', columns='p_adj_thr', values='zscore').fillna(0)
sns.heatmap(z, annot=hm, fmt='', cmap='Blues', cbar_kws={'label': 'Z-score\n(permutations)'},
            vmin=9,
            vmax=50)
plt.title('associations between activity layer and TF (GEX)')
Text(0.5, 1.0, 'associations between activity layer and TF (GEX)')
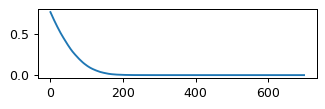
cumulative = np.cumsum(res.sort_values('p_adj')['p_adj']) / 100
plt.plot(range(len(cumulative)), cumulative[::-1])
[<matplotlib.lines.Line2D at 0x708177124400>]
shuffled[0].sort_values('p_val')
| filter_id | opt_log_dynamic | archetype_id | gene_name | matched | spearman | p_val | module_name | p_adj | |
|---|---|---|---|---|---|---|---|---|---|
| 2 | 95 | False | 8 | Scrt1 | True | -0.448074 | 0.000000e+00 | HD/8 | 0.000000e+00 |
| 34 | 257 | False | 54 | Tpm4 | True | -0.413388 | 9.271101e-302 | AP1/1 | 4.403773e-300 |
| 22 | 216 | False | 70 | Tk1 | True | -0.378365 | 3.646135e-249 | TBX/1 | 1.154609e-247 |
| 36 | 257 | False | 54 | Zeb1 | True | -0.321987 | 4.015730e-177 | AP1/1 | 9.537358e-176 |
| 31 | 221 | False | 53 | Arhgap11a | True | -0.309905 | 1.477263e-163 | AP1/2 | 2.806799e-162 |
| ... | ... | ... | ... | ... | ... | ... | ... | ... | ... |
| 13 | 195 | False | 248 | Tubb2a | True | -0.002399 | 8.369483e-01 | NR/20 | 8.737372e-01 |
| 41 | 27 | True | 203 | Glis2 | True | -0.002243 | 8.474755e-01 | FOX/8 | 8.751106e-01 |
| 67 | 196 | True | 2 | Arnt2 | True | -0.001967 | 8.660415e-01 | HD/2 | 8.846660e-01 |
| 62 | 173 | True | 32 | Tspan11 | True | -0.001081 | 9.261391e-01 | NR/3 | 9.359916e-01 |
| 53 | 91 | True | 273 | Trim3 | True | -0.000737 | 9.495875e-01 | ZIC | 9.495875e-01 |
95 rows × 9 columns
res.sort_values('p_adj')
| filter_id | opt_log_dynamic | archetype_id | gene_name | matched | spearman | p_val | module_name | p_adj | |
|---|---|---|---|---|---|---|---|---|---|
| 349 | 280 | False | 281 | Pax6 | True | -0.565214 | 0.000000 | PAX/1 | 0.000000 |
| 177 | 69 | False | 70 | Tagln3 | True | -0.554236 | 0.000000 | TBX/1 | 0.000000 |
| 175 | 69 | False | 70 | Ttc3 | True | -0.484895 | 0.000000 | TBX/1 | 0.000000 |
| 174 | 69 | False | 70 | Tmsb4x | True | -0.476951 | 0.000000 | TBX/1 | 0.000000 |
| 169 | 69 | False | 70 | Ttyh1 | True | 0.522790 | 0.000000 | TBX/1 | 0.000000 |
| ... | ... | ... | ... | ... | ... | ... | ... | ... | ... |
| 509 | 69 | True | 70 | Tor1b | True | 0.000547 | 0.962586 | TBX/1 | 0.968118 |
| 580 | 69 | True | 70 | Tmem132c | True | 0.000217 | 0.985119 | TBX/1 | 0.989359 |
| 77 | 57 | False | 58 | Mitf | True | 0.000195 | 0.986676 | Ebox/CACGTG/1 | 0.989504 |
| 635 | 127 | True | 128 | Nfia | True | 0.000143 | 0.990214 | NFI/3 | 0.991630 |
| 518 | 69 | True | 70 | Thrb | True | 0.000102 | 0.993010 | TBX/1 | 0.993010 |
700 rows × 9 columns
from statsmodels.stats.multitest import fdrcorrection
res['p_adj'] = fdrcorrection(res['p_val'])[1]
# res[res['p_adj'] < 0.1]
genes_by_module_name = res.groupby(['module_name'])['gene_name'].apply(lambda grp: list(grp.value_counts().index)).to_dict()
# genes_by_module_name
res.sort_values('p_adj')
| filter_id | opt_log_dynamic | archetype_id | gene_name | matched | spearman | p_val | module_name | p_adj | |
|---|---|---|---|---|---|---|---|---|---|
| 349 | 280 | False | 281 | Pax6 | True | -0.565214 | 0.000000 | PAX/1 | 0.000000 |
| 177 | 69 | False | 70 | Tagln3 | True | -0.554236 | 0.000000 | TBX/1 | 0.000000 |
| 175 | 69 | False | 70 | Ttc3 | True | -0.484895 | 0.000000 | TBX/1 | 0.000000 |
| 174 | 69 | False | 70 | Tmsb4x | True | -0.476951 | 0.000000 | TBX/1 | 0.000000 |
| 169 | 69 | False | 70 | Ttyh1 | True | 0.522790 | 0.000000 | TBX/1 | 0.000000 |
| ... | ... | ... | ... | ... | ... | ... | ... | ... | ... |
| 509 | 69 | True | 70 | Tor1b | True | 0.000547 | 0.962586 | TBX/1 | 0.968118 |
| 580 | 69 | True | 70 | Tmem132c | True | 0.000217 | 0.985119 | TBX/1 | 0.989359 |
| 77 | 57 | False | 58 | Mitf | True | 0.000195 | 0.986676 | Ebox/CACGTG/1 | 0.989504 |
| 635 | 127 | True | 128 | Nfia | True | 0.000143 | 0.990214 | NFI/3 | 0.991630 |
| 518 | 69 | True | 70 | Thrb | True | 0.000102 | 0.993010 | TBX/1 | 0.993010 |
700 rows × 9 columns
res['k'] = res['gene_name'] + '_' + res['archetype_id'].astype(str)
df2 = res.pivot(index='k', columns='opt_log_dynamic', values='spearman')
# df2 = res # .pivot(index='k', columns='opt_log_dynamic', values='spearman')
df2
| opt_log_dynamic | False | True |
|---|---|---|
| k | ||
| Arap2_248 | 0.050344 | 0.032765 |
| Arfgef3_248 | 0.194122 | 0.083080 |
| Arg2_248 | 0.174381 | 0.030984 |
| Arhgap11a_248 | -0.396027 | -0.015390 |
| Arhgap20_248 | 0.092057 | 0.035744 |
| ... | ... | ... |
| Zeb1_68 | -0.061055 | 0.016079 |
| Zic1_110 | -0.065828 | 0.019893 |
| Zic1_273 | -0.013335 | 0.005078 |
| Zic2_273 | -0.072651 | 0.022927 |
| Zic4_273 | -0.008062 | -0.017463 |
350 rows × 2 columns
mb.pl.set_rcParams({'figure.figsize': [5, 4], 'figure.dpi': 120})
# df2 = df2.sort_values('matched', ascending=True)
# plt.scatter(df2[True], df2[True],
#             color=np.where(df2['matched'], 'blue', 'gray'),
#             s=np.where(df2['matched'], 30, 5))
# plt.xlabel('TF activity (graph = off)')
# plt.ylabel('TF activity (graph = on)')
# plt.axhline(0, color='gray', ls='--', zorder=0)
# plt.axvline(0, color='gray', ls='--', zorder=0)
# df2[df2['matched'] == True].sort_values(True, ascending=False)
# res['arch_name'] = name_by_filter_id
res.sort_values('p_adj')
| filter_id | opt_log_dynamic | archetype_id | gene_name | matched | spearman | p_val | module_name | p_adj | k | |
|---|---|---|---|---|---|---|---|---|---|---|
| 349 | 280 | False | 281 | Pax6 | True | -0.565214 | 0.000000 | PAX/1 | 0.000000 | Pax6_281 |
| 177 | 69 | False | 70 | Tagln3 | True | -0.554236 | 0.000000 | TBX/1 | 0.000000 | Tagln3_70 |
| 175 | 69 | False | 70 | Ttc3 | True | -0.484895 | 0.000000 | TBX/1 | 0.000000 | Ttc3_70 |
| 174 | 69 | False | 70 | Tmsb4x | True | -0.476951 | 0.000000 | TBX/1 | 0.000000 | Tmsb4x_70 |
| 169 | 69 | False | 70 | Ttyh1 | True | 0.522790 | 0.000000 | TBX/1 | 0.000000 | Ttyh1_70 |
| ... | ... | ... | ... | ... | ... | ... | ... | ... | ... | ... |
| 509 | 69 | True | 70 | Tor1b | True | 0.000547 | 0.962586 | TBX/1 | 0.968118 | Tor1b_70 |
| 580 | 69 | True | 70 | Tmem132c | True | 0.000217 | 0.985119 | TBX/1 | 0.989359 | Tmem132c_70 |
| 77 | 57 | False | 58 | Mitf | True | 0.000195 | 0.986676 | Ebox/CACGTG/1 | 0.989504 | Mitf_58 |
| 635 | 127 | True | 128 | Nfia | True | 0.000143 | 0.990214 | NFI/3 | 0.991630 | Nfia_128 |
| 518 | 69 | True | 70 | Thrb | True | 0.000102 | 0.993010 | TBX/1 | 0.993010 | Thrb_70 |
700 rows × 10 columns
rcParams['figure.figsize'] = 4, 4
rcParams['figure.dpi'] = 90
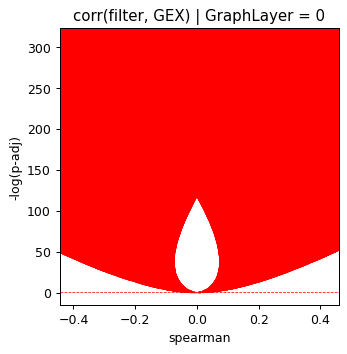
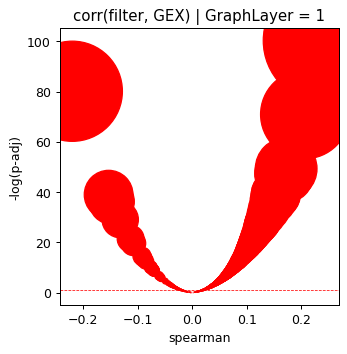
for optimize_log_dynamic, grp in res.groupby('opt_log_dynamic'):
grp['minus_log10_pval'] = -np.log10(grp['p_val'])
grp = grp.sort_values('matched')
plt.scatter(grp['spearman'], grp['minus_log10_pval'],
s=np.power(grp['minus_log10_pval'], 2), color=np.where(grp['matched'], 'red', 'blue'))
plt.ylabel('-log(p-adj)')
plt.xlabel('spearman')
plt.title('corr(filter, GEX) | GraphLayer = %i' % optimize_log_dynamic)
plt.axhline(1, ls='--', color='red', lw=0.6)
plt.show()
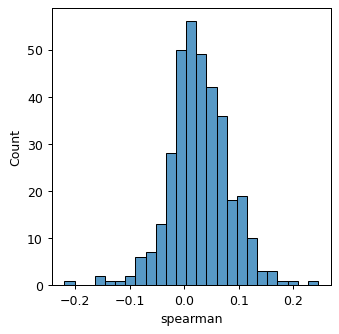
sns.histplot(grp['spearman'])
<Axes: xlabel='spearman', ylabel='Count'>
# sc.pl.umap(ad, color=[96], cmap='RdBu_r')
# sc.pl.umap(rna_sel, color=['Ehf', 'Ergic2'], cmap='plasma')
rcParams['figure.figsize'] = 3, 3
rcParams['figure.dpi'] = 90
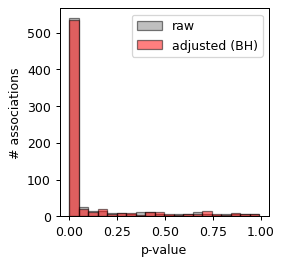
plt.hist(res['p_val'], color='gray', bins=20, label='raw', alpha=.5, edgecolor = 'black')
plt.hist(res['p_adj'], color='red', bins=20, label='adjusted (BH)', alpha=.5, edgecolor = 'black')
plt.xlabel('p-value')
plt.legend()
plt.ylabel('# associations')
Text(0, 0.5, '# associations')
res[res['p_adj'] < 0.05]
| filter_id | opt_log_dynamic | archetype_id | gene_name | matched | spearman | p_val | module_name | p_adj | k | |
|---|---|---|---|---|---|---|---|---|---|---|
| 0 | 0 | False | 1 | Lhx6 | True | -0.087736 | 4.712331e-14 | HD/1 | 1.186558e-13 | Lhx6_1 |
| 1 | 1 | False | 2 | Pou6f2 | True | -0.025458 | 2.897336e-02 | HD/2 | 3.855770e-02 | Pou6f2_2 |
| 2 | 1 | False | 2 | Lhx9 | True | -0.051279 | 1.076960e-05 | HD/2 | 1.861412e-05 | Lhx9_2 |
| 3 | 1 | False | 2 | Emx2 | True | 0.417677 | 1.202446e-308 | HD/2 | 1.957471e-307 | Emx2_2 |
| 4 | 1 | False | 2 | Arx | True | 0.442665 | 0.000000e+00 | HD/2 | 0.000000e+00 | Arx_2 |
| ... | ... | ... | ... | ... | ... | ... | ... | ... | ... | ... |
| 690 | 247 | True | 248 | Arap2 | True | 0.032765 | 4.939153e-03 | NR/20 | 7.099398e-03 | Arap2_248 |
| 691 | 248 | True | 249 | Hsf2 | True | 0.045000 | 1.126444e-04 | HSF | 1.833745e-04 | Hsf2_249 |
| 693 | 261 | True | 262 | Gli3 | True | 0.111026 | 1.269628e-21 | GLI | 3.847356e-21 | Gli3_262 |
| 694 | 262 | True | 263 | Tfap2c | True | 0.064515 | 3.037541e-08 | TFAP2/2 | 6.075081e-08 | Tfap2c_263 |
| 695 | 263 | True | 264 | Tfap2c | True | 0.026947 | 2.079786e-02 | TFAP2/1 | 2.805106e-02 | Tfap2c_264 |
534 rows × 10 columns
pval_thr = 1e-5
sel_genes = set(list(res[res['p_adj'] < pval_thr]['gene_name']))
log_act = ad.obsm['log_activities'].copy()
cols_act = ['intercept', 'dinuc_bias'] + [name_by_filter_id[k] for k in log_act.columns[2:]]
log_act.columns = cols_act
import anndata
ad_act = anndata.AnnData(log_act)
ad_act.obsm['X_umap'] = ad.obsm['X_umap']
ad_act.obs = ad.obs
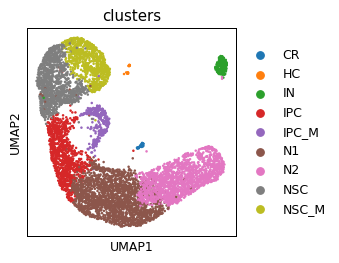
sc.pl.umap(ad_act, color=cell_type_key)
Rank genes groups using the annotation
sc.tl.rank_genes_groups(ad_act, cell_type_key)
rkg_df = []
for ct in ad_act.obs[cell_type_key].values.unique():
    print(ct)
    rkg_df2 = sc.get.rank_genes_groups_df(ad_act, ct)
    rkg_df2[cell_type_key] = ct
    rkg_df.append(rkg_df2)
rkg_df = pd.concat(rkg_df)
rkg_df['module_name'] = rkg_df['names'].map(anno.set_index('Cluster_ID')['Name'].to_dict())
rkg_df['module_name'] = np.where(~pd.isnull(rkg_df['module_name']), rkg_df['module_name'], rkg_df['names'])
rkg_df.head()
NSC_M
N1
IPC
NSC
IPC_M
N2
CR
HC
IN
| names | scores | logfoldchanges | pvals | pvals_adj | clusters | module_name | |
|---|---|---|---|---|---|---|---|
| 0 | ZKSCAN1 | 21.499275 | NaN | 6.172890e-84 | 1.777792e-81 | NSC_M | ZKSCAN1 |
| 1 | OVOL1 | 21.026897 | NaN | 4.155369e-81 | 5.983731e-79 | NSC_M | OVOL1 |
| 2 | SIX/2 | 20.639223 | NaN | 1.388494e-78 | 1.332954e-76 | NSC_M | SIX/2 |
| 3 | ZNF28 | 20.028900 | NaN | 5.744338e-75 | 4.135924e-73 | NSC_M | ZNF28 |
| 4 | POU/1 | 20.026346 | NaN | 1.253743e-74 | 5.512854e-73 | NSC_M | POU/1 |
Get top modules
ad_act.var_names = ad_act.var_names.map(rkg_df.set_index('names')['module_name'].to_dict())
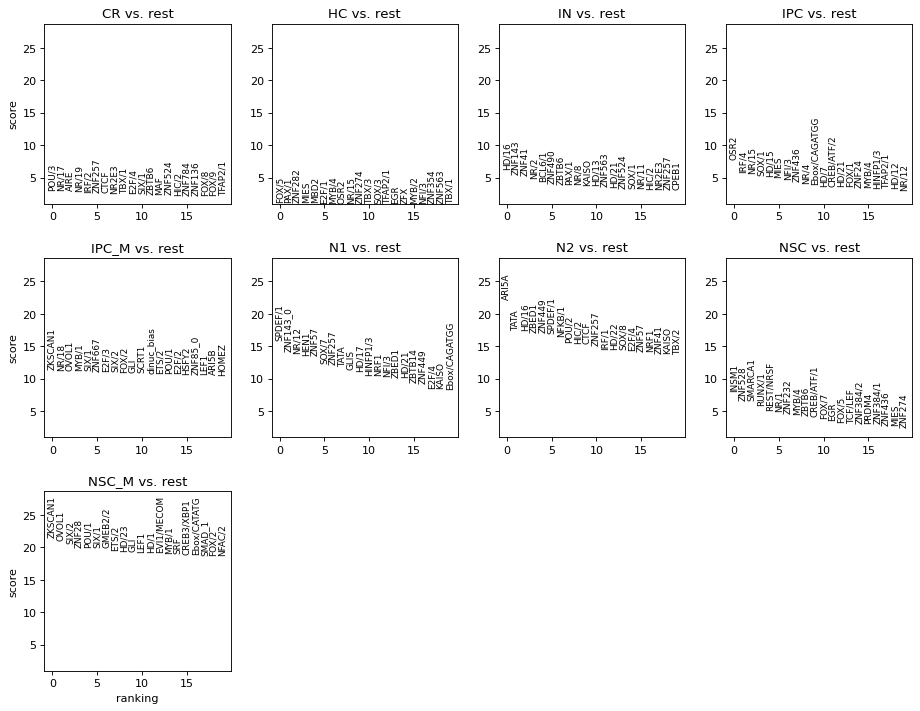
sc.tl.rank_genes_groups(ad_act, cell_type_key)
rcParams['figure.figsize'] = 3.5, 3.5
rcParams['figure.dpi'] = 80
sc.pl.rank_genes_groups(ad_act)
# set(res[(res['p_adj'] < 1e-5)]['k'])
res[res['module_name'].str.contains('HD')].sort_values('p_adj')
| filter_id | opt_log_dynamic | archetype_id | gene_name | matched | spearman | p_val | module_name | p_adj | k | |
|---|---|---|---|---|---|---|---|---|---|---|
| 4 | 1 | False | 2 | Arx | True | 0.442665 | 0.000000e+00 | HD/2 | 0.000000e+00 | Arx_2 |
| 3 | 1 | False | 2 | Emx2 | True | 0.417677 | 1.202446e-308 | HD/2 | 1.957471e-307 | Emx2_2 |
| 14 | 7 | False | 8 | Arx | True | 0.338170 | 2.673819e-196 | HD/8 | 2.529289e-195 | Arx_8 |
| 25 | 24 | False | 25 | Otx1 | True | 0.287126 | 1.145098e-139 | HD/19 | 8.015689e-139 | Otx1_25 |
| 5 | 1 | False | 2 | Lhx2 | True | 0.203768 | 8.111656e-70 | HD/2 | 3.785439e-69 | Lhx2_2 |
| 15 | 11 | False | 12 | Pbx3 | True | 0.107847 | 1.741761e-20 | HD/12 | 5.101392e-20 | Pbx3_12 |
| 375 | 24 | True | 25 | Otx1 | True | 0.095321 | 2.519745e-16 | HD/19 | 6.706546e-16 | Otx1_25 |
| 12 | 6 | False | 7 | Emx1 | True | -0.089355 | 1.599046e-14 | HD/7 | 4.100117e-14 | Emx1_7 |
| 0 | 0 | False | 1 | Lhx6 | True | -0.087736 | 4.712331e-14 | HD/1 | 1.186558e-13 | Lhx6_1 |
| 353 | 1 | True | 2 | Emx2 | True | 0.086231 | 1.264470e-13 | HD/2 | 3.138755e-13 | Emx2_2 |
| 364 | 7 | True | 8 | Arx | True | 0.084481 | 3.901094e-13 | HD/8 | 9.548132e-13 | Arx_8 |
| 358 | 1 | True | 2 | Dlx2 | True | -0.076006 | 6.644946e-11 | HD/2 | 1.515134e-10 | Dlx2_2 |
| 9 | 1 | False | 2 | Dlx1 | True | -0.075870 | 7.185656e-11 | HD/2 | 1.633104e-10 | Dlx1_2 |
| 8 | 1 | False | 2 | Dlx2 | True | -0.075378 | 9.521906e-11 | HD/2 | 2.150108e-10 | Dlx2_2 |
| 13 | 6 | False | 7 | Emx2 | True | -0.072867 | 3.896794e-10 | HD/7 | 8.659543e-10 | Emx2_7 |
| 359 | 1 | True | 2 | Dlx1 | True | -0.071776 | 7.085803e-10 | HD/2 | 1.554878e-09 | Dlx1_2 |
| 356 | 1 | True | 2 | Lhx6 | True | -0.071258 | 9.382253e-10 | HD/2 | 2.033306e-09 | Lhx6_2 |
| 6 | 1 | False | 2 | Lhx6 | True | -0.067680 | 6.188324e-09 | HD/2 | 1.277825e-08 | Lhx6_2 |
| 365 | 11 | True | 12 | Pbx3 | True | 0.061053 | 1.593298e-07 | HD/12 | 3.030729e-07 | Pbx3_12 |
| 350 | 0 | True | 1 | Lhx6 | True | -0.060752 | 1.832731e-07 | HD/1 | 3.476726e-07 | Lhx6_1 |
| 362 | 6 | True | 7 | Emx1 | True | -0.058989 | 4.107983e-07 | HD/7 | 7.709351e-07 | Emx1_7 |
| 361 | 1 | True | 2 | Dlx5 | True | -0.057247 | 8.916844e-07 | HD/2 | 1.633977e-06 | Dlx5_2 |
| 2 | 1 | False | 2 | Lhx9 | True | -0.051279 | 1.076960e-05 | HD/2 | 1.861412e-05 | Lhx9_2 |
| 360 | 1 | True | 2 | Emx1 | True | -0.041471 | 3.729508e-04 | HD/2 | 5.853489e-04 | Emx1_2 |
| 376 | 25 | True | 26 | Otx1 | True | -0.039517 | 6.971208e-04 | HD/20 | 1.079612e-03 | Otx1_26 |
| 354 | 1 | True | 2 | Arx | True | 0.034019 | 3.515226e-03 | HD/2 | 5.126372e-03 | Arx_2 |
| 11 | 1 | False | 2 | Dlx5 | True | -0.029789 | 1.060204e-02 | HD/2 | 1.475433e-02 | Dlx5_2 |
| 1 | 1 | False | 2 | Pou6f2 | True | -0.025458 | 2.897336e-02 | HD/2 | 3.855770e-02 | Pou6f2_2 |
| 363 | 6 | True | 7 | Emx2 | True | 0.024577 | 3.500362e-02 | HD/7 | 4.605740e-02 | Emx2_7 |
| 10 | 1 | False | 2 | Emx1 | True | -0.022922 | 4.926321e-02 | HD/2 | 6.397820e-02 | Emx1_2 |
| 355 | 1 | True | 2 | Lhx2 | True | 0.021151 | 6.963238e-02 | HD/2 | 8.910908e-02 | Lhx2_2 |
| 357 | 1 | True | 2 | Lmx1a | True | -0.020188 | 8.333184e-02 | HD/2 | 1.049142e-01 | Lmx1a_2 |
| 352 | 1 | True | 2 | Lhx9 | True | 0.006688 | 5.662073e-01 | HD/2 | 6.154427e-01 | Lhx9_2 |
| 26 | 25 | False | 26 | Otx1 | True | 0.006461 | 5.794501e-01 | HD/20 | 6.288606e-01 | Otx1_26 |
| 351 | 1 | True | 2 | Pou6f2 | True | -0.002236 | 8.479277e-01 | HD/2 | 8.690328e-01 | Pou6f2_2 |
| 7 | 1 | False | 2 | Lmx1a | True | -0.001761 | 8.799552e-01 | HD/2 | 8.966064e-01 | Lmx1a_2 |
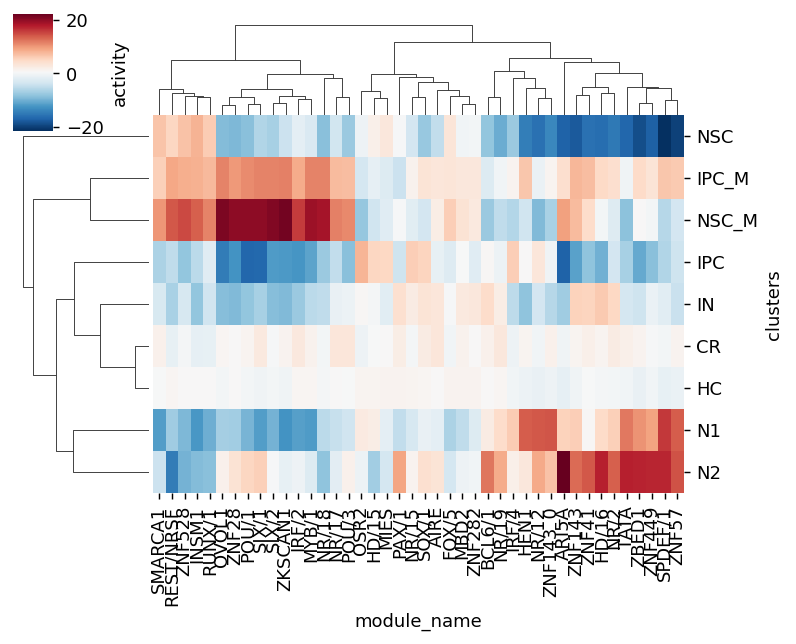
mod_names_best = set(rkg_df.sort_values('scores', ascending=False).groupby(cell_type_key).head(5)['module_name'])
best = rkg_df[rkg_df['module_name'].isin(mod_names_best)]
rcParams['figure.dpi'] = 130
sns.clustermap(best.pivot(index=cell_type_key, columns='module_name', values='scores'),
               cbar_kws={'label': 'activity'}, cmap='RdBu_r',
               # vmin=-5, vmax=5,
               figsize=[6.2, 5],
               # dpi=100,
               xticklabels=True)
<seaborn.matrix.ClusterGrid at 0x708174318100>
rna_tfs = rna_sel.to_df()[list(set(res['gene_name']))]
rna_tfs[cell_type_key] = rna_sel.obs[cell_type_key]
mean_tfs = rna_tfs.groupby(cell_type_key).mean()

act_tfs_df = ad_act.to_df()
act_tfs_df[cell_type_key] = ad_act.obs[cell_type_key]
mean_act_tf = act_tfs_df.groupby(cell_type_key).mean()
corr_celltype = []
for i, c1 in enumerate(mean_act_tf):
    if i % 50 == 0:
        print(i, mean_act_tf.shape[1])
    for j, c2 in enumerate(mean_tfs):
        if not c1 in genes_by_module_name or not c2 in genes_by_module_name[c1]:
            continue
        a = mean_act_tf[c1]
        b = mean_tfs[c2]
        corr_celltype.append([c1, c2, mean_act_tf.index[np.argmax(mean_act_tf[c1])]] + list(pearsonr(a, b)))

corr = pd.DataFrame(corr_celltype,
                    columns=['module_name', 'gene_name', 'cell_type', 'pearsonr', 'p_val'])
corr = corr.sort_values('pearsonr', ascending=False)
0 288
50 288
100 288
150 288
200 288
250 288
# sc.pl.dotplot(rna_sel, groupby='celltype', var_names=list(set(res['gene_name'])))
corr[corr['pearsonr'] > 0].sort_values('p_val')
| module_name | gene_name | cell_type | pearsonr | p_val | |
|---|---|---|---|---|---|
| 179 | HIF | Epas1 | HC | 0.927976 | 0.000308 |
| 349 | NFI/2 | Nfia | CR | 0.899426 | 0.000962 |
| 85 | NR/20 | Nr3c1 | HC | 0.883691 | 0.001574 |
| 123 | CREB/ATF/2 | Junb | HC | 0.873790 | 0.002074 |
| 83 | NR/20 | Arsb | HC | 0.852563 | 0.003497 |
| ... | ... | ... | ... | ... | ... |
| 9 | KLF/SP/2 | Egr1 | IPC_M | 0.037409 | 0.923880 |
| 178 | ETS/2 | Ets1 | IPC_M | 0.029951 | 0.939031 |
| 274 | TBX/1 | Ttyh1 | HC | 0.021263 | 0.956700 |
| 198 | FOX/5 | Foxo1 | HC | 0.002574 | 0.994756 |
| 194 | HD/2 | Pou6f2 | IPC_M | 0.001198 | 0.997560 |
178 rows × 5 columns
from matplotlib.pyplot import rcParams
rcParams['figure.dpi'] = 150
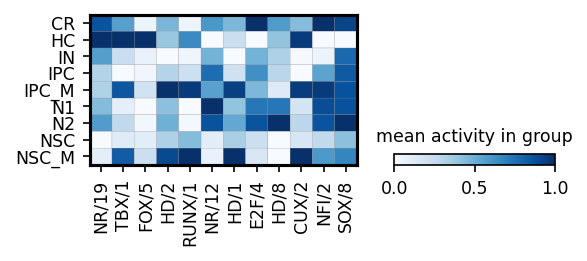
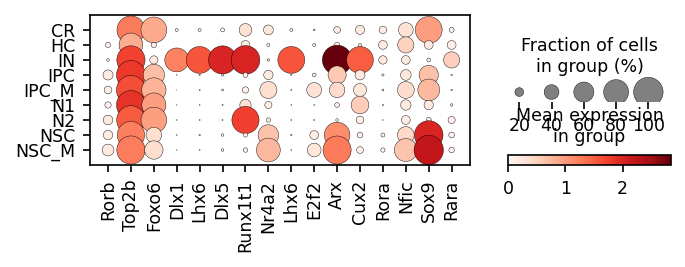
# repressors
print('repressors')
module_names = corr[corr['pearsonr'] < 0].sort_values('p_val').sort_values('p_val').groupby('cell_type').head(3)['module_name'].drop_duplicates()
gene_names = corr[corr['pearsonr'] < 0].sort_values('p_val').sort_values('p_val').groupby('cell_type').head(3)['gene_name']
sc.pl.matrixplot(ad_act,
groupby=cell_type_key,
cmap='Blues',
var_names=module_names,
figsize=[4, 1.3],
standard_scale='var',
colorbar_title='mean activity in group')
repressors
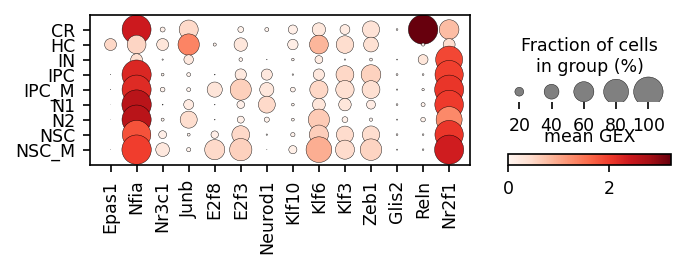
sc.pl.dotplot(rna_sel,
              groupby=cell_type_key,
              # colorbar_title='mean GEX',
              var_names=gene_names,
              figsize=[5, 1.3])
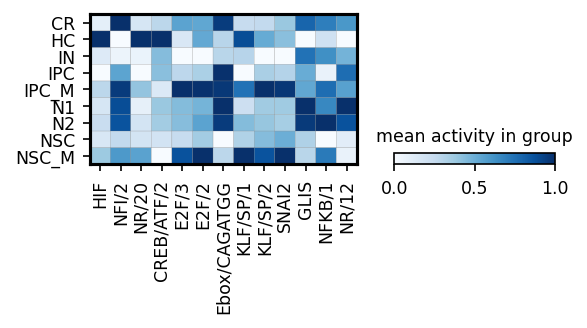
# activators
rcParams['pdf.fonttype'] = 42

module_names = corr[corr['pearsonr'] > 0].sort_values('p_val').sort_values('p_val').groupby('cell_type').head(3)['module_name'].drop_duplicates()
gene_names   = corr[corr['pearsonr'] > 0].sort_values('p_val').sort_values('p_val').groupby('cell_type').head(3)['gene_name']
sc.pl.matrixplot(ad_act,
            groupby=cell_type_key,
            cmap='Blues',
            var_names=module_names,
            figsize=[4, 1.3],
            show=False,
            standard_scale='var',
            colorbar_title='mean activity in group')

plt.savefig('../../../output/filter_activities_neurogenesis.pdf')
plt.show()


sc.pl.dotplot(rna_sel,
              show=False,
              groupby=cell_type_key,
              colorbar_title='mean GEX',
              var_names=gene_names,
              figsize=[5, 1.3])

plt.savefig('../../../output/gene_expression_neurogenesis.pdf')
plt.show()
filter_id_by_name = {v: k for k, v in zip(name_by_filter_id.keys(), name_by_filter_id.values())}
custom_names = pd.Series(['NFI/1', 'E2F/4', 'HD/2', 'GLI', 'HSF', 'POU/3', 'PAX/1', 'CUX/1', 'KLF/SP/2', 'NR/14', 'HD/19'])
# custom_names = pd.Series(['FOX/4',])
custom_names.map(res.set_index('module_name')['filter_id'].to_dict()),
(0     188
 1     157
 2       1
 3     261
 4     248
 5      82
 6     280
 7      13
 8     108
 9      42
 10     24
 dtype: int64,)
for k in list(anno.sort_values('Cluster_ID')['Name']):
    if k != 'GLI':
        continue
    print(k)
    mb.pl.logo(
        model,
        title=False,
        xticks=False,
        rowspan_dinuc=0,
        rowspan_mono=1,
        n_rows=40,
        log_odds=True,
        # stop_at=11,
        show=False,
        # n_rows=len(res.head(20).index),
        n_cols=1,
        order=pd.Series([k]).map(filter_id_by_name) + 2,
    )  # n_cols=len(reduced_groups))
    # plt.tight_layout()
    plt.show()
GLI
res.drop_duplicates('filter_id')
| filter_id | opt_log_dynamic | archetype_id | gene_name | matched | spearman | p_val | module_name | p_adj | k | |
|---|---|---|---|---|---|---|---|---|---|---|
| 0 | 0 | False | 1 | Lhx6 | True | -0.087736 | 4.712331e-14 | HD/1 | 1.186558e-13 | Lhx6_1 |
| 1 | 1 | False | 2 | Pou6f2 | True | -0.025458 | 2.897336e-02 | HD/2 | 3.855770e-02 | Pou6f2_2 |
| 12 | 6 | False | 7 | Emx1 | True | -0.089355 | 1.599046e-14 | HD/7 | 4.100117e-14 | Emx1_7 |
| 14 | 7 | False | 8 | Arx | True | 0.338170 | 2.673819e-196 | HD/8 | 2.529289e-195 | Arx_8 |
| 15 | 11 | False | 12 | Pbx3 | True | 0.107847 | 1.741761e-20 | HD/12 | 5.101392e-20 | Pbx3_12 |
| ... | ... | ... | ... | ... | ... | ... | ... | ... | ... | ... |
| 343 | 261 | False | 262 | Gli3 | True | 0.230897 | 1.198642e-89 | GLI | 6.261564e-89 | Gli3_262 |
| 344 | 262 | False | 263 | Tfap2c | True | 0.189942 | 9.700005e-61 | TFAP2/2 | 4.297471e-60 | Tfap2c_263 |
| 345 | 263 | False | 264 | Tfap2c | True | -0.319823 | 1.201576e-174 | TFAP2/1 | 1.051379e-173 | Tfap2c_264 |
| 346 | 272 | False | 273 | Zic4 | True | -0.008062 | 4.892764e-01 | ZIC | 5.368236e-01 | Zic4_273 |
| 349 | 280 | False | 281 | Pax6 | True | -0.565214 | 0.000000e+00 | PAX/1 | 0.000000e+00 | Pax6_281 |
99 rows × 10 columns
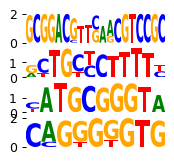
print(custom_names.map(res.set_index('module_name')['filter_id'].to_dict()))
mb.pl.set_rcParams({"figure.figsize": [2, 20], "figure.dpi": 90})
mb.pl.logo(
    model,
    title=False,
    xticks=False,
    rowspan_dinuc=0,
    rowspan_mono=1,
    n_rows=40,
    log_odds=True,
    # stop_at=11,
    show=False,
    # n_rows=len(res.head(20).index),
    n_cols=1,
    order=custom_names.map(filter_id_by_name) + 2,
)  # n_cols=len(reduced_groups))
# plt.tight_layout()

plt.savefig('../../../output/motif_neurogenes_publication.pdf')
plt.show()
0     188
1     157
2       1
3     261
4     248
5      82
6     280
7      13
8     108
9      42
10     24
dtype: int64
custom_names = pd.Series(['SOX/3', 'NR/11', 'CCAAT/CEBP', 'PRDM1'])

print(custom_names.map(res.set_index('module_name')['filter_id'].to_dict()))
mb.pl.set_rcParams({"figure.figsize": [2, 20], "figure.dpi": 90})
mb.pl.logo(
    model,
    title=False,
    xticks=False,
    rowspan_dinuc=0,
    rowspan_mono=1,
    n_rows=40,
    log_odds=True,
    # stop_at=11,
    show=False,
    # n_rows=len(res.head(20).index),
    n_cols=1,
    order=custom_names.map(filter_id_by_name) + 2,
)  # n_cols=len(reduced_groups))
# plt.tight_layout()

plt.savefig('../../../output/motif_pancreatic_endocrinogenesis_publication_subset.pdf')
plt.show()
0     91
1     39
2     51
3    104
dtype: int64
mb.pl.set_rcParams({"figure.figsize": [2, 20], "figure.dpi": 90})
mb.pl.logo(
    model,
    title=False,
    xticks=False,
    rowspan_dinuc=0,
    rowspan_mono=1,
    log_odds=True,
    n_rows=40,
    # stop_at=11,
    show=False,
    # n_rows=len(res.head(20).index),
    n_cols=1,
    # log_odds=True,
    order=module_names.map(res.set_index('module_name')['filter_id'].to_dict()),
)  # n_cols=len(reduced_groups))
# plt.tight_layout()

plt.show()
mb.pl.logo(
    model,
    title=False,
    xticks=False,
    rowspan_dinuc=0,
    rowspan_mono=1,
    n_rows=40,
    # stop_at=11,
    show=False,
    # n_rows=len(res.head(20).index),
    n_cols=1,
    log_odds=True,
    order=module_names.map(res.set_index('module_name')['filter_id'].to_dict()),
)  # n_cols=len(reduced_groups))
# plt.tight_layout()
plt.show()
# assert False

plt.savefig('../../../output/motif_neurogenesis.pdf')
plt.show()
<Figure size 180x1800 with 0 Axes>
!readlink -f ../../../output/motif_neurogenesis.pdf
/home/ilibarra/workspace/theislab/mubind/output/motif_neurogenesis.pdf
Filter activities versus graph activities
A = model.get_log_activities()
sum_A = A.abs().sum(axis=1).cpu().detach().numpy()
A = A.squeeze(0)
print(A.shape)
torch.Size([288, 7359])
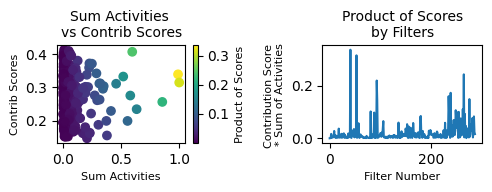
# this function assesses the contributions of A on the graph
indices, contributions, max_eig = mb.tl.compute_contributions(A.cpu(), C.cpu(), D.cpu())

contributions_normalized = torch.abs(contributions) / max_eig
contributions_df = pd.DataFrame(contributions_normalized.detach(), columns=['index'])
print("Summary statistics of the normalized contributions: \n")
contributions_df.describe()
Summary statistics of the normalized contributions:
| index | |
|---|---|
| count | 288.000000 |
| mean | 0.264926 |
| std | 0.065371 |
| min | 0.146912 |
| 25% | 0.209978 |
| 50% | 0.260296 |
| 75% | 0.314351 |
| max | 0.413175 |
from matplotlib.pyplot import rcParams
rcParams['figure.dpi'] = 100
plt.figure(figsize=(10, 5))

print(f"Percentage of non-zero entries of the filter matrix A: {100 * torch.sum(A != 0).item() / A.numel()} %")
mb.pl.filter_contrib_simple(contributions_normalized, A.cpu())
Percentage of non-zero entries of the filter matrix A: 100.0 %
<Figure size 1000x500 with 0 Axes>
# normalize the data, and look at summary stats
sum_A_norm = sum_A / np.max(sum_A)
sum_A_df = pd.DataFrame(sum_A.T, columns=['sum_A'])
sum_A_df.describe()
| sum_A | |
|---|---|
| count | 288.000000 |
| mean | 0.746615 |
| std | 1.270342 |
| min | 0.000068 |
| 25% | 0.119778 |
| 50% | 0.301893 |
| 75% | 0.753946 |
| max | 9.227266 |
contrib_arr = contributions_normalized.unsqueeze(dim=0).detach().numpy()
sum_A = A.cpu().abs().sum(axis=1).detach().numpy()
contrib = contrib_arr[0]

contrib_times_activities = contrib * sum_A
contrib_times_activities_norm = contrib_times_activities / np.max(contrib_times_activities)
contrib_times_activities_df = pd.DataFrame(contrib_times_activities, columns=['contribution_times_activities'])
contrib_times_activities_df.describe()
| contribution_times_activities | |
|---|---|
| count | 288.000000 |
| mean | 0.202153 |
| std | 0.379312 |
| min | 0.000013 |
| 25% | 0.029517 |
| 50% | 0.080536 |
| 75% | 0.179532 |
| max | 3.099209 |
from matplotlib.pyplot import rcParams
rcParams['figure.dpi'] = 80

# unsqueeze the data to make it compatible with the heatmap function
sum_A_norm = sum_A_norm.reshape(1,-1)
contrib_times_activities = contrib_times_activities.reshape(1,-1)


# # only plotting filters, that are within the top 25% of the maximum contribution score
# mb.pl.contrib_heatmaps(contributions_normalized,
#                        sum_A.reshape(1, -1),
#                        contrib_times_activities,
#                        cmap='Reds')
#                        # (0.66, 11.85, 6.49),
#                        # (0.66, 11.85, 6.49)) # vmin values come from the describe() functions

# # plotting top 25% of filters normalized
# mb.pl.contrib_heatmaps(contributions_normalized,
#                        sum_A_norm,
#                        contrib_times_activities_norm.reshape(1,-1),
#                        cmap='Reds')
#                        # vmins=(0.66, 0.14, 0.19),
#                        # centers=(0.66, 0.14, 0.19)) # vmin values come from the describe() functions

# # plotting all filter
# mb.pl.contrib_heatmaps(contributions_normalized,
#                        sum_A.reshape(1, -1),
#                        contrib_times_activities,
#                        cmap='Reds')

# # plotting all filters normalized
# mb.pl.contrib_heatmaps(contributions_normalized,
#                        sum_A_norm,
#                        contrib_times_activities,
#                        cmap='Reds')
res['graph_score'] = res['filter_id'].map({i : contrib_times_activities[0][i + 2] for i in range(len(contrib_times_activities[0]) - 2)})
# grnpedia associations
ttrust = pd.read_csv('https://www.grnpedia.org/trrust/data/trrust_rawdata.mouse.tsv',
                     sep='\t',
                     header=None)
ttrust.columns = ['tf', 'target', 'role', 'ref']
ttrust = ttrust.groupby(['tf', 'role']).size().reset_index().pivot(index='tf', columns='role', values=0).fillna(0)
ttrust['consensus'] = np.where((ttrust['Activation'] > 0) & (ttrust['Repression'] == 0), 'red',
                               np.where((ttrust['Repression'] > 0) & (ttrust['Activation'] == 0), 'blue', 'purple'))
# res_sel.sort_values('act_change')
print('here...')
here...
def delta_models(model_by_logdynamic, func='mean'):
    model = model_by_logdynamic[True]
    model = model_by_logdynamic[True]

    log_act1 = torch.stack(list(model.activities.log_activities), dim=1).squeeze(0)
    if func == 'expsum':
        log_act1 = log_act1.exp() / log_act1.exp().sum()
    log_act1 = pd.DataFrame(log_act1.detach().cpu().numpy())

    model = model_by_logdynamic[False]
    log_act2 = torch.stack(list(model.activities.log_activities), dim=1).squeeze(0)
    if func == 'expsum':
        log_act2 = log_act2.exp() / log_act2.exp().sum()
    log_act2 = pd.DataFrame(log_act2.detach().cpu().numpy())

    d = None
    if func == 'mean':
        d = log_act1.mean(axis=0) - log_act2.mean(axis=0)
        d = pd.DataFrame(d, columns=['delta'])
        d['graph_on'] = log_act1.mean(axis=0)
        d['graph_off'] = log_act2.mean(axis=0)
        return d
    elif func == 'abssum' or func == 'expsum':
        d = log_act1.abs().sum(axis=0) - log_act2.abs().sum(axis=0)
        d = pd.DataFrame(d, columns=['delta'])
        d['graph_on'] = log_act1.abs().sum(axis=0)
        d['graph_off'] = log_act2.abs().sum(axis=0)
        return d
# graph = True - graph = False
delta_model = delta_models(model_by_logdynamic, func='expsum')
delta_model
delta_model = delta_model[2:]
delta_model.index = range(len(delta_model))
delta_model.index += 1
delta_model.index = delta_model.index.map(name_by_filter_id)
delta_model
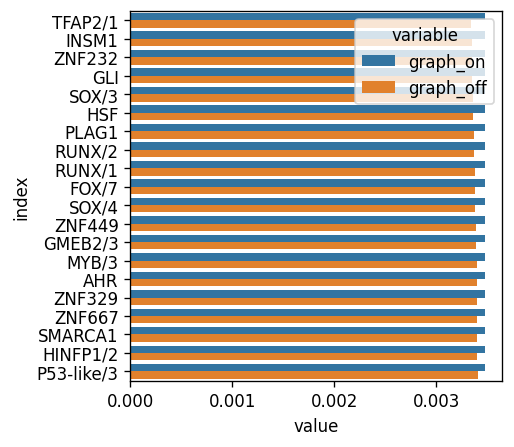
n_select = 20
top_delta = delta_model.sort_values('delta', ascending=False).reset_index()['index'][:n_select]
bar_df = delta_model.sort_values('delta', ascending=False).reset_index().melt(id_vars='index', value_vars=['graph_on', 'graph_off'])
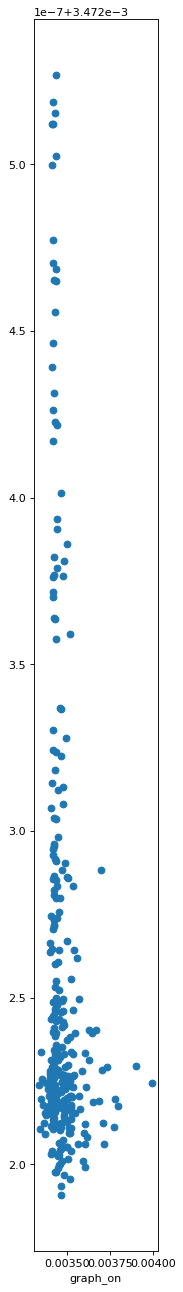
plt.scatter(delta_model['graph_off'], delta_model['graph_on'])
plt.xlabel('graph_off')
plt.xlabel('graph_on')
Text(0.5, 0, 'graph_on')
delta_model.sort_values('delta', ascending=False)
| delta | graph_on | graph_off | |
|---|---|---|---|
| TFAP2/1 | 0.000133 | 0.003472 | 0.003339 |
| INSM1 | 0.000128 | 0.003472 | 0.003344 |
| ZNF232 | 0.000121 | 0.003472 | 0.003351 |
| GLI | 0.000120 | 0.003472 | 0.003353 |
| SOX/3 | 0.000118 | 0.003472 | 0.003355 |
| ... | ... | ... | ... |
| MECP2 | -0.000300 | 0.003472 | 0.003773 |
| HD/21 | -0.000308 | 0.003472 | 0.003780 |
| PRDM1 | -0.000324 | 0.003472 | 0.003797 |
| NFAT/3 | -0.000428 | 0.003472 | 0.003900 |
| BCL6/1 | -0.000522 | 0.003472 | 0.003994 |
286 rows × 3 columns
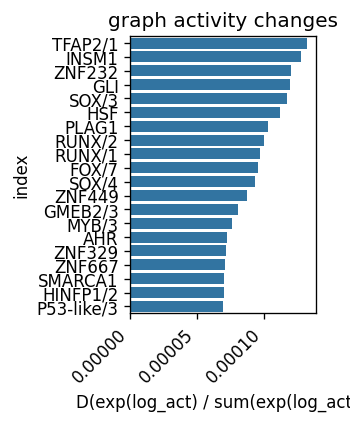
rcParams['figure.dpi'] = 120
rcParams['figure.figsize'] = 2, 3
sns.barplot(data=delta_model.sort_values('delta', ascending=0).reset_index().head(20), x='delta', y='index')
plt.title('graph activity changes')
plt.xticks(rotation=45, ha='right')
plt.xlabel('D(exp(log_act) / sum(exp(log_act)))')
plt.savefig('../../../output/delta_log_act_exp_neurogenesis.pdf')
plt.show()
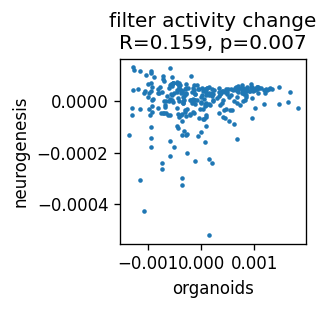
# if the delta organoid values are provided, then load and compare
delta_organoids = pd.read_csv('../../../output/delta_log_act_exp_organoids.csv', index_col=0)

delta_model['dataset'] = 'mouse_neurogenesis'
delta_organoids['dataset'] = 'human_organoids'
index_human = delta_organoids.sort_values('delta', ascending=0).reset_index().head(10)['index']
index_mouse = delta_model.sort_values('delta', ascending=0).reset_index().head(10)['index']
# delta_both.shape
order = delta_model.sort_values('delta', ascending=0).index
order_sel = set(order[order.isin(index_human) | order.isin(index_mouse)])
delta_both_all = pd.concat([delta_organoids, delta_model])
delta_both = pd.concat([delta_organoids.reindex(order_sel), delta_model.reindex(order_sel)])
rcParams['figure.figsize'] = 2, 2
pivot_df = delta_both_all.reset_index().pivot(index='index', columns='dataset', values='delta')

from scipy import stats
corr_result = stats.pearsonr(pivot_df['human_organoids'], pivot_df['mouse_neurogenesis'])
print(corr_result.statistic, corr_result.pvalue)

pivot_df.shape

plt.scatter(pivot_df['human_organoids'], pivot_df['mouse_neurogenesis'], s=3)
plt.xlabel('organoids')
plt.ylabel('neurogenesis')
plt.title('filter activity change\nR=%.3f, p=%.3f' % (corr_result.statistic, corr_result.pvalue))
plt.savefig("../../../output/changes_organoids_and_neurogenesis.pdf")
0.15945890483794758 0.006888308954743277
delta_model
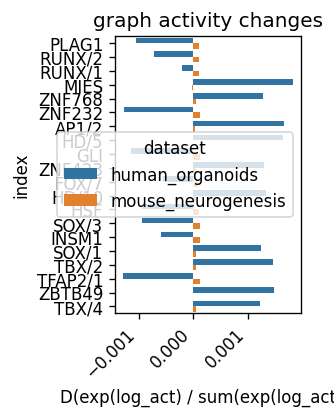
rcParams['figure.dpi'] = 120
rcParams['figure.figsize'] = 2, 3
sns.barplot(data=delta_both[delta_both.index.isin(index_human) | delta_both.index.isin(index_mouse)].reset_index(), x='delta', y='index', hue='dataset')
plt.title('graph activity changes')
plt.xticks(rotation=45, ha='right')
plt.xlabel('D(exp(log_act) / sum(exp(log_act)))')
# plt.savefig('../../../output/delta_log_act_exp_neurogenesis.pdf')
plt.show()
rcParams['figure.dpi'] = 120
rcParams['figure.figsize'] = 4, 4
sns.barplot(data=bar_df[bar_df['index'].isin(top_delta)], y='index', x='value', hue='variable')
<Axes: xlabel='value', ylabel='index'>
rcParams['figure.figsize'] = 3, 3
rcParams['figure.dpi'] = 250
rcParams['pdf.fonttype'] = 42

from adjustText import adjust_text

res['act_change'] = res['module_name'].map(delta_model['delta'].to_dict())
res['k'] = res['module_name'] + ':' + res['gene_name']
res['graph_score'] = res['filter_id'].map({i : contrib_times_activities[0][i + 2] for i in range(len(contrib_times_activities[0]) - 2)})
res['z'] = np.sqrt((res['graph_score'] ** 2) * (-np.log(res['p_adj'] + 1e-10)) ** 2)
ax = plt.subplot()
cmap = sns.color_palette('RdBu_r', as_cmap=True)

res = res[res['opt_log_dynamic']]

res_sel = res.sort_values('z', ascending=False)
res_sel = res_sel.sort_values('z', ascending=False) # .drop_duplicates('module_name')
# res_sel = res_sel.drop_duplicates('module_name')

# res_sel['x'] = np.log((res_sel['graph_score'] + 1) * (res_sel['act_change'].abs() + 1))
res_sel['x'] = res_sel['graph_score'] * res_sel['act_change'].abs() * res_sel['spearman'].abs()

edgecolors = res_sel['gene_name'].map(ttrust['consensus'].to_dict())
edgecolors = np.where(~pd.isnull(edgecolors), edgecolors, 'gray')
res_sel['edgecolors'] = edgecolors
plt.scatter(res_sel['x'],
            res_sel['spearman'],
            s=-np.log(res_sel['p_adj'] + 1e-10),
            cmap=cmap,
            lw=.3,
            edgecolors='black', # res_sel['edgecolors'],
            c=res_sel['act_change'])
plt.axhline(y=0, ls='--', c='gray', lw=1.0)
plt.xlabel('graph-weighted TF-activity', fontsize=9) # G_layer * abs(act) * abs(rho(GEX, act))'
plt.ylabel('TF-activity', fontsize=9) # rho(GEX, act)


res_sel = res_sel.sort_values('x', ascending=False) # .drop_duplicates('module_name')
texts = [] # [plt.text(x[i], y[i], 'Text%s' %i, ha='center', va='center') for i in range(len(x))]

for ri, r in res_sel.head(20).iterrows():
    print(r['module_name'] + ':' + r['gene_name'], (r['x'], r['spearman']), r['act_change'])
    t = ax.annotate(r['module_name'] + ':' + r['gene_name'], (r['x'], r['spearman']), fontsize=5, color=r['edgecolors'])
    texts.append(t)
adjust_text(texts, arrowprops=dict(arrowstyle='->'))

plt.savefig('../../../output/graph_contribution_neurogenesis.pdf')
plt.show()
SOX/4:Sox9 (2.6940284748144043e-05, -0.21938014712945927) 9.35655552893877e-05
PRDM1:Prdm16 (1.7878811798104274e-05, -0.0917151767367197) -0.0003243109676986933
GLI:Gli3 (1.3551140259722075e-05, 0.11102551480230653) 0.0001196127850562334
SOX/3:Sox9 (1.0259301609975559e-05, 0.04313964387916473) 0.00011771381832659245
TFAP2/1:Tfap2c (8.012593530772662e-06, 0.026946638604905353) 0.00013288320042192936
FOX/7:Foxo6 (6.919009080482413e-06, 0.13544323504533537) 9.542983025312424e-05
FOX/5:Foxo1 (6.210382466767795e-06, 0.036868129675778) -0.00017945002764463425
FOX/5:Foxg1 (4.44730826936683e-06, 0.026401584582038062) -0.00017945002764463425
PROX1:Prox1 (3.524228383859824e-06, -0.0336303518997785) 6.584427319467068e-05
HSF:Hsf2 (3.455791458989058e-06, 0.04499997110184604) 0.00011199456639587879
CCAAT/CEBP:Nfil3 (3.290349327573295e-06, 0.10397394464617533) 1.0900432243943214e-05
NFI/2:Nfia (3.0298595178163996e-06, 0.20648198706902032) -0.00023232167586684227
FOX/5:Foxp2 (2.5312771524808906e-06, -0.015027005953720259) -0.00017945002764463425
NR/20:Arl8a (1.9309410569596035e-06, 0.15273841786958656) -1.2870179489254951e-05
NR/20:Arx (1.6643902425396363e-06, -0.13165411313142938) -1.2870179489254951e-05
NR/20:Arpp21 (1.6210791709593557e-06, 0.1282281853820735) -1.2870179489254951e-05
NR/18:Nr4a2 (1.5378417109534286e-06, -0.035655297524747366) -0.00013304082676768303
FOX/5:Foxo6 (1.506451276516502e-06, -0.008943095100833237) -0.00017945002764463425
NR/20:Arhgef25 (1.3615367006675356e-06, 0.107698244222318) -1.2870179489254951e-05
NR/20:Arhgef2 (1.3466272342832835e-06, 0.1065188978623643) -1.2870179489254951e-05
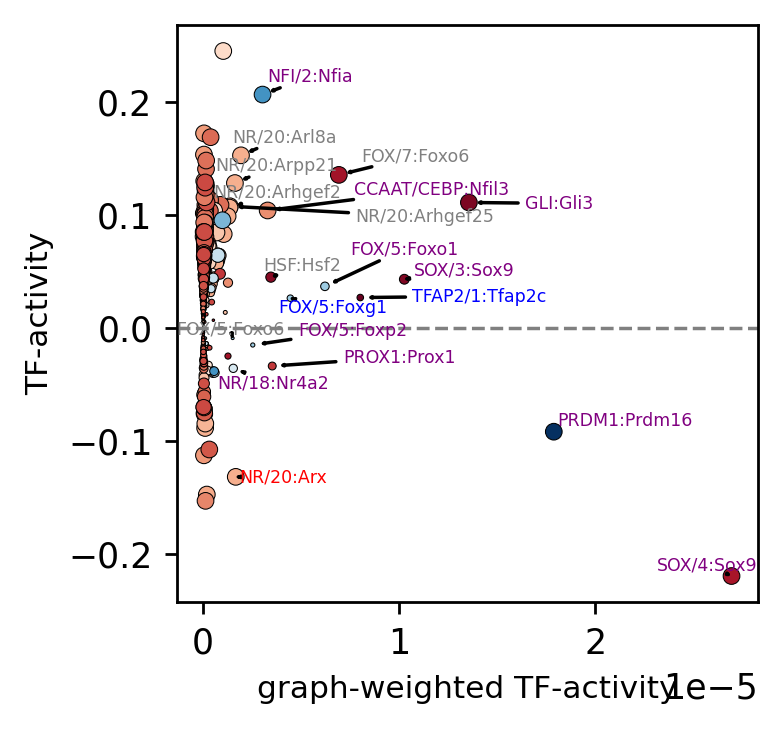
pwd
'/home/ilibarra/workspace/theislab/mubind/docs/notebooks/single_cell'
import pylab as pl
import numpy as np

a = np.array([[res_sel['act_change'].min(), res_sel['act_change'].max()]])
pl.figure(figsize=(3, .2))
img = pl.imshow(a, cmap="RdBu_r")
pl.gca().set_visible(False)
cax = pl.axes([0.1, 0.2, 0.8, 0.6])
pl.colorbar(orientation="horizontal", cax=cax)
pl.savefig("../../../output/graph_contribution_neurogenesis_cbar.pdf")
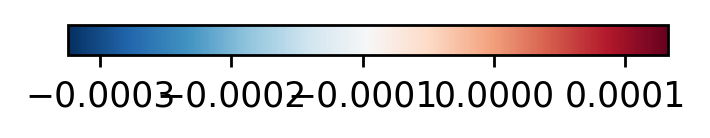
!readlink -f ../../../output/graph_contribution_neurogenesis.pdf
/home/ilibarra/workspace/theislab/mubind/output/graph_contribution_neurogenesis.pdf
print('here...')
here...
def running_mean(y_in, x_in, N_out=101, sigma=.05):
    '''
    Returns running mean as a Bell-curve weighted average at evenly spaced
    points. Does NOT wrap signal around, or pad with zeros.

    Arguments:
    y_in -- y values, the values to be smoothed and re-sampled
    x_in -- x values for array

    Keyword arguments:
    N_out -- NoOf elements in resampled array.
    sigma -- 'Width' of Bell-curve in units of param x .
    '''
    import numpy as np
    N_in = len(y_in)

    # Gaussian kernel
    x_out = np.linspace(np.min(x_in), np.max(x_in), N_out)
    x_in_mesh, x_out_mesh = np.meshgrid(x_in, x_out)
    gauss_kernel = np.exp(-np.square(x_in_mesh - x_out_mesh) / (2 * sigma**2))
    # Normalize kernel, such that the sum is one along axis 1
    normalization = np.tile(np.reshape(np.sum(gauss_kernel, axis=1), (N_out, 1)), (1, N_in))
    gauss_kernel_normalized = gauss_kernel / normalization
    # Perform running average as a linear operation
    y_out = gauss_kernel_normalized @ y_in

    return y_out, x_out
def plot_chromatin(filter_name, sigma_chrom,
                   group_key=None, key_sel=None,
                   q_thr=.95, show=True, save=None):
    res_sel = res[res['module_name'].str.contains(filter_name)]['filter_id']
    if res_sel.shape[0] == 0:
        print('not found')
        return None
    filter_id = int(res_sel.values[0])
    print(filter_id)
    scores = binding_per_mode[:,filter_id]
    # filter scores across regions
    # plt.hist(scores)

    if group_key is not None and key_sel is not None:
        ad_sel = ad[ad.obs[group_key] == key_sel]
    else:
        ad_sel = ad
    print('here')

    var_idx = np.argwhere(scores >= np.quantile(scores, q_thr)).flatten()
    var_names = ad_sel.var_names[var_idx]
    print(q_thr, var_names.shape)
    # background with all peaks
    var_names_neg = ad_sel.var_names[~ad.var_names.isin(var_names)]

    x = ad_sel.obs['velocity_pseudotime']
    y = ad_sel[:,var_names].X.mean(axis=1).A.flatten()
    # y = np.log(y)
    # y[y == -np.inf] = np.nanmin(y[y != -np.inf])
    y_mean, x_mean = running_mean(y, x, sigma=sigma_chrom)
    plt.scatter(x, y, edgecolors=None, color='lightblue', s=.1)
    plt.plot(x_mean, y_mean, color='blue', label='targets')
    plt.ylabel('')
    plt.title(filter_name + ((', %s' % key_sel) if key_sel is not None else ''))
    plt.ylabel('chromatin accessibility [mean]')
    plt.xlabel('pseudotime')
    # plt.show()

    print(q_thr, var_names_neg.shape)
    x = ad_sel.obs['velocity_pseudotime']
    y = ad_sel[:,var_names_neg].X.mean(axis=1).A.flatten()
    # y = np.log(y)
    # y[y == -np.inf] = np.nanmin(y[y != -np.inf])
    y_mean_avr, x_mean = running_mean(y, x, sigma=sigma_chrom)
    # plt.scatter(x, y, edgecolors=None, color='lightblue', s=.1)
    plt.plot(x_mean, y_mean_avr, color='gray', linestyle='--', label='non-targets')
    plt.ylabel('')
    plt.ylabel('chromatin accessibility [mean]')
    plt.xlabel('pseudotime')
    plt.legend()

    if save is not None:
        plt.savefig(save + '_filter.pdf')
    if not show:
        plt.close()
    else:
        plt.show()
    return (y_mean - y_mean_avr).sum()

def plot_pseudotime(rna, gene_name, filter_name, sigma_gex=.05, sigma_filter=.1, save=None):
    rcParams['figure.figsize'] = 3, 2
    gene_key = gene_name
    x = rna.obs['velocity_pseudotime']
    y = rna[:,rna.var_names==gene_key].X.A.flatten()
    y = np.log(y)
    y[y == -np.inf] = np.nanmin(y[y != -np.inf])

    y_mean, x_mean = running_mean(y, x, sigma=sigma_gex)
    plt.scatter(x, y, edgecolors=None, color='lightgreen', s=.1)
    plt.plot(x_mean, y_mean, color='green')
    plt.ylabel('')
    plt.title(gene_key)
    plt.ylabel('gene expression [log]')
    plt.xlabel('pseudotime')


    x = ad.obs['velocity_pseudotime']

    if save is not None:
        plt.savefig(save + '_gex.pdf')
    plt.show()
    filter_id = int(res[res['module_name'].str.contains(filter_name)]['filter_id'].values[0])

    y= act_on.T.numpy()[:,filter_id]
    # y = np.abs(y)
    # y = np.log(y)
    # y[y == -np.inf] = np.nanmin(y[y != -np.inf])

    y_mean, x_mean = running_mean(y, x, sigma=sigma_filter)
    # plt.scatter(x, y, edgecolors='black', color='lightgreen', s=.1)
    plt.plot(x_mean, y_mean, color='red')
    plt.ylabel('')
    plt.title('filter activities %s' % filter_name)
    plt.ylabel('filter activity')
    plt.xlabel('pseudotime')

    if save is not None:
        plt.savefig(save + '_filter.pdf')

    # plt.close()
    plt.show()
plot_pseudotime(rna_sample, 'Prdm16', 'PRDM1', sigma_gex=.05, sigma_filter=.1, save='../../../output/neurogenesis_prdm1')
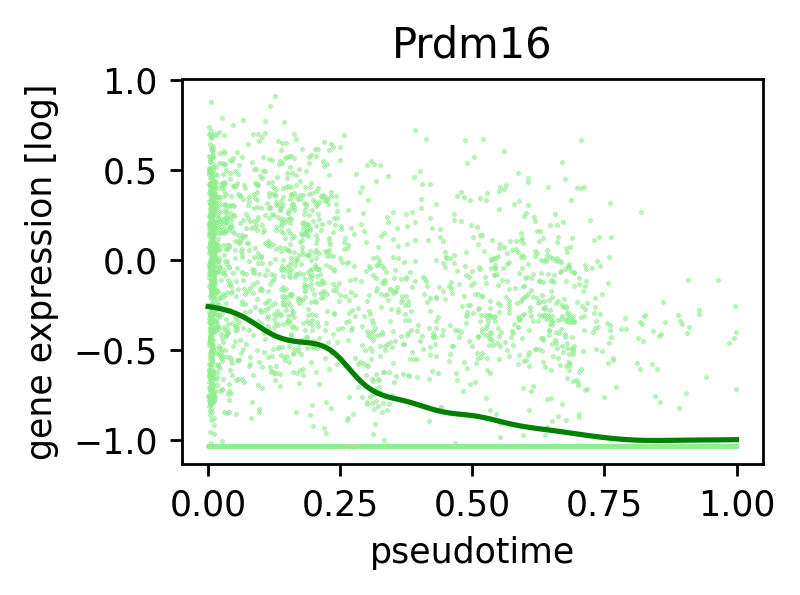
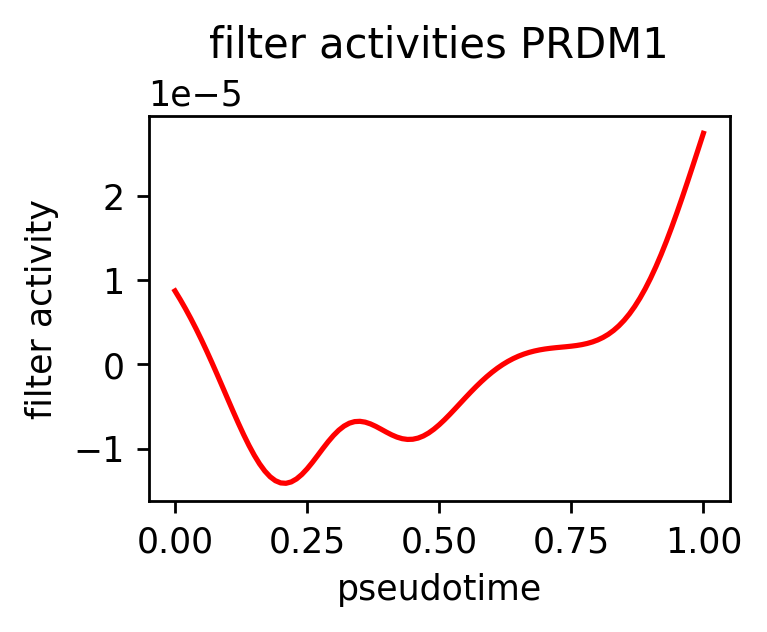
plot_pseudotime(rna_sample, 'Gli3', 'GLI', sigma_gex=.05, sigma_filter=.1, save='../../../output/neurogenesis_gli3')
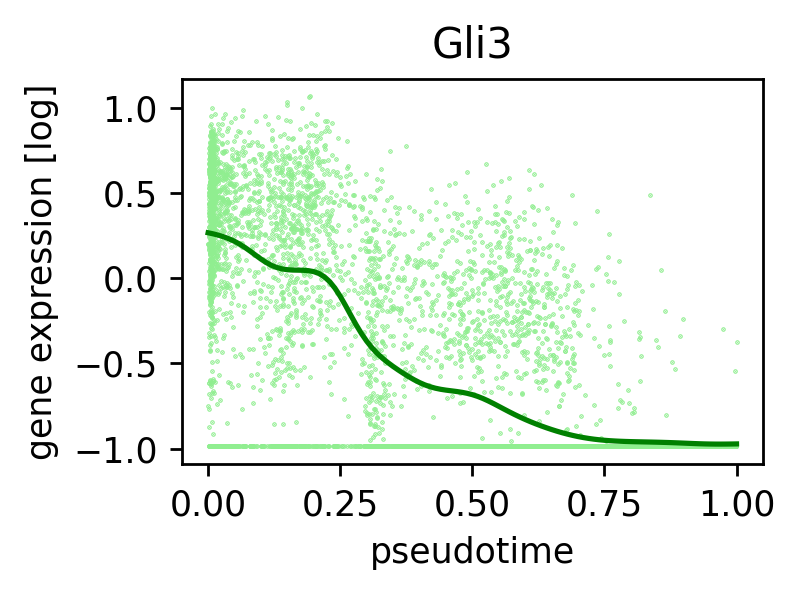
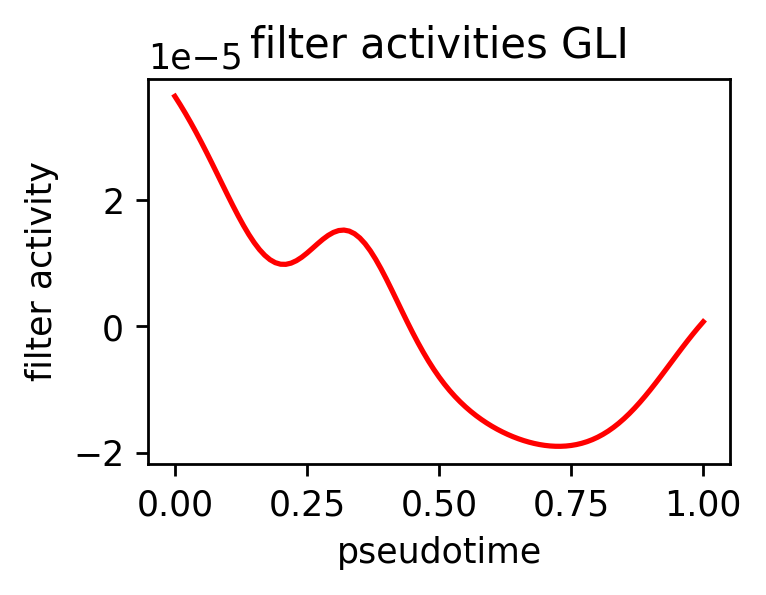
plot_pseudotime(rna_sample, 'Sox9', 'SOX/3', sigma_gex=.05, sigma_filter=.1, save='../../../output/neurogenesis_sox9')
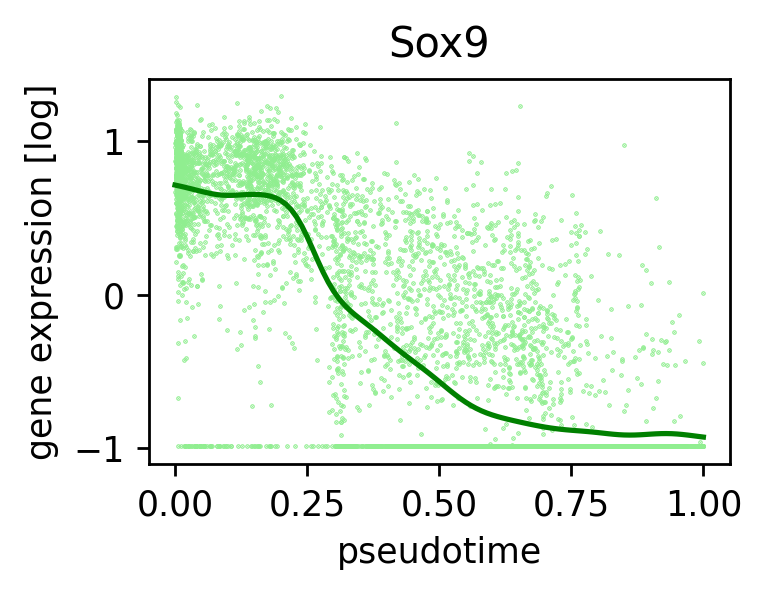
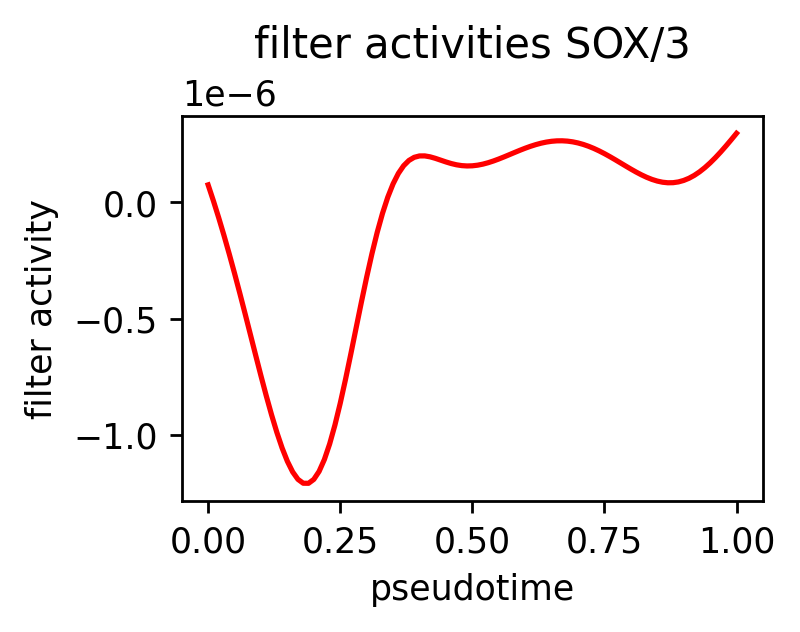
plot_pseudotime(rna_sample, 'Foxg1', 'FOX/5', sigma_gex=.05, sigma_filter=.1, save='../../../output/neurogenesis_foxg1')
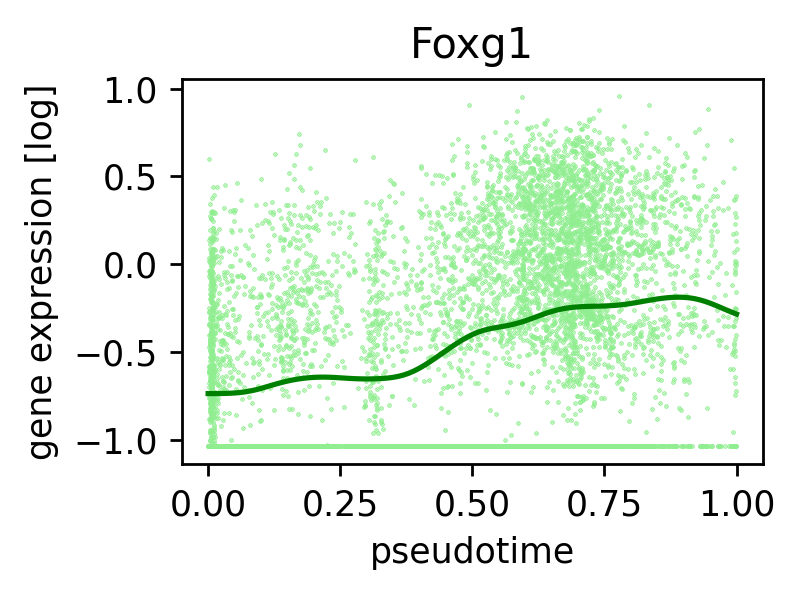
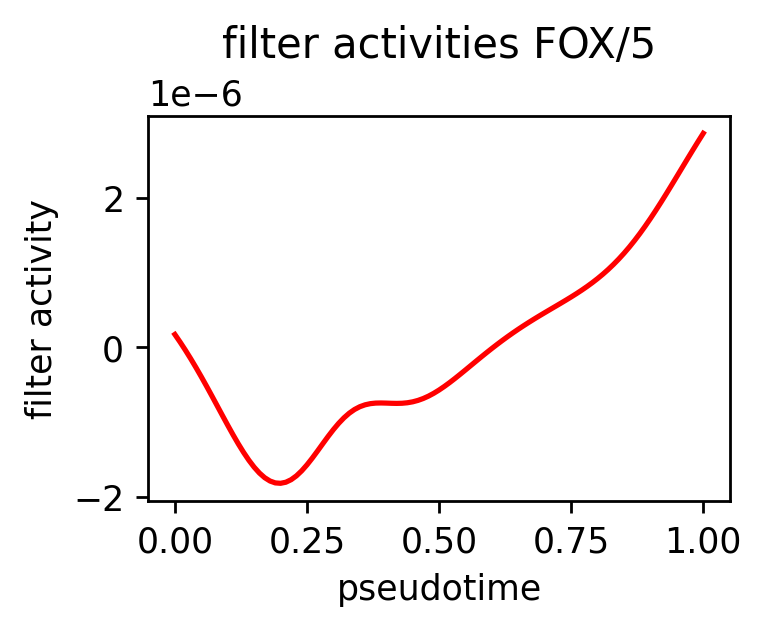
plot_pseudotime(rna_sample, 'Foxo6', 'FOX/5', sigma_gex=.05, sigma_filter=.1)
plot_pseudotime(rna_sample, 'Foxo6', 'FOX/5', sigma_gex=.05, sigma_filter=.1)
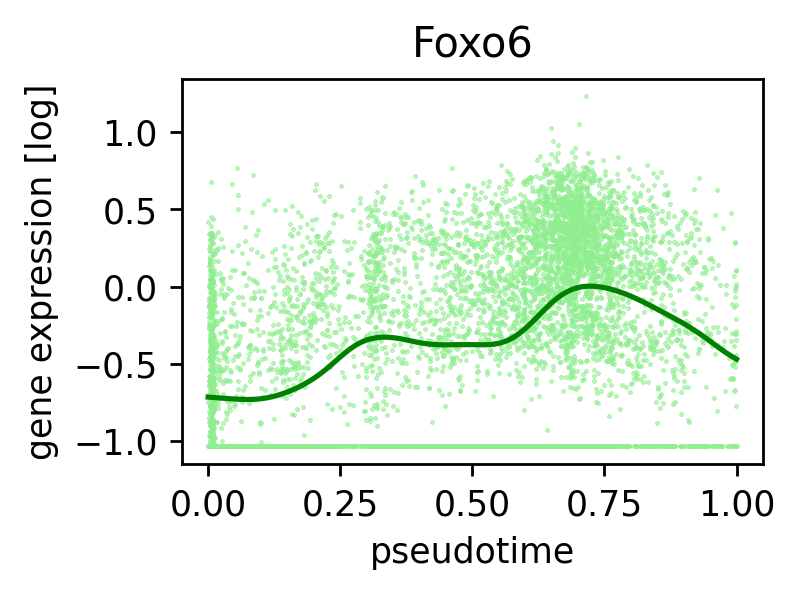
rcParams['figure.figsize'] = 5, 5
rcParams['figure.dpi'] = 80
sc.pl.umap(rna_sample, color=['Foxo6'], cmap='Reds') #  'Nfil3', 'Arl8a', 'Rara', 'Tfap2c', 'Sox9', 'Qsox1', cell_type_key])
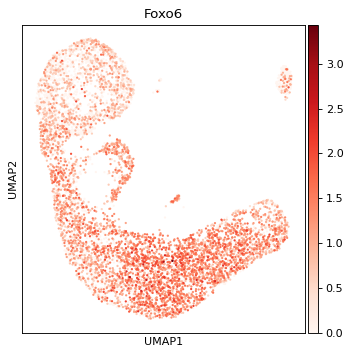
print('here...')
here...
# debug here almost done.

tsum = torch.sum
texp = torch.exp
tspa = torch.sparse_coo_tensor
tsmm = torch.sparse.mm
t = torch.transpose

log_dynamic = model.graph_module.log_dynamic
D = model.graph_module.log_dynamic
D_tril = tspa(a_ind, D, C.shape)  # .requires_grad_(True).cuda()
D_triu = tspa(a_ind, -D, C.shape)  # .requires_grad_(True).cuda()
D = D_tril + t(D_triu, 0, 1)
# log_dynamic = log_dynamic + -torch.transpose(log_dynamic, 0, 1)
# triu_indices = torch.triu_indices(row=n_rounds, col=n_rounds, offset=1)
D
tensor(indices=tensor([[   0,    0,    0,  ..., 6906, 6980, 7289],
                       [   1,  251,  289,  ..., 7358, 7358, 7358]]),
       values=tensor([ 0.13,  0.51,  0.50,  ..., -0.50, -0.50, -0.50]),
       device='cuda:0', size=(7359, 7359), nnz=280548, layout=torch.sparse_coo,
       grad_fn=<AddBackward0>)
ad.layers['velocity'] = torch.stack([D.detach().cpu().to_dense().sum(axis=1),] * ad.shape[1], axis=1).numpy()
ad.layers['counts'] = ad.X
# with the new velocity graph based on learned weights, calculate the
scv.tl.velocity_graph(ad, vkey='velocity', xkey='counts')
computing velocity graph (using 1/20 cores)
WARNING: Unable to create progress bar. Consider installing `tqdm` as `pip install tqdm` and `ipywidgets` as `pip install ipywidgets`,
or disable the progress bar using `show_progress_bar=False`.
    finished (0:00:01) --> added
    'velocity_graph', sparse matrix with cosine correlations (adata.uns)
rcParams['figure.figsize'] = 5, 5,
scv.pl.velocity_embedding_stream(ad,
                                 legend_fontsize=10,
                                 color=cell_type_key,
                                 linewidth=.1,
                                 save="../../../output/neurogenesis_graph_layer.svg")
computing velocity embedding
    finished (0:00:00) --> added
    'velocity_umap', embedded velocity vectors (adata.obsm)
saving figure to file ../../../output/neurogenesis_graph_layer.svg
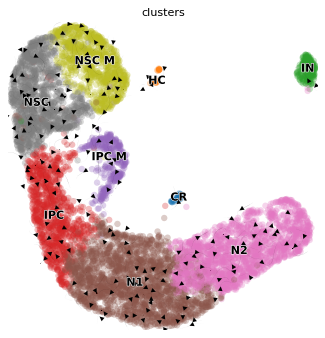
sc.pl.embedding_density(ad[ad.obs_names[:3]], basis='umap', key='umap_density_dynamic_score_z1', group='dynamic', color_map='viridis', edge_colors='black')
                        # save="dynamic_scores_neurogenesis.pdf") # basis='umap', groupby='dynamic_score_cluster')
---------------------------------------------------------------------------
AttributeError                            Traceback (most recent call last)
Cell In[187], line 1
----> 1 sc.pl.embedding_density(ad[ad.obs_names[:3]], basis='umap', key='umap_density_dynamic_score_z1', group='dynamic', color_map='viridis', edge_colors='black')
      2                         # save="dynamic_scores_neurogenesis.pdf") # basis='umap', groupby='dynamic_score_cluster')

File ~/miniconda3/envs/mubind/lib/python3.9/site-packages/legacy_api_wrap/__init__.py:80, in legacy_api.<locals>.wrapper.<locals>.fn_compatible(*args_all, **kw)
     77 @wraps(fn)
     78 def fn_compatible(*args_all: P.args, **kw: P.kwargs) -> R:
     79     if len(args_all) <= n_positional:
---> 80         return fn(*args_all, **kw)
     82     args_pos: P.args
     83     args_pos, args_rest = args_all[:n_positional], args_all[n_positional:]

File ~/miniconda3/envs/mubind/lib/python3.9/site-packages/scanpy/plotting/_tools/__init__.py:1626, in embedding_density(adata, basis, key, groupby, group, color_map, bg_dotsize, fg_dotsize, vmax, vmin, vcenter, norm, ncols, hspace, wspace, title, show, save, ax, return_fig, **kwargs)
   1623     else:
   1624         _title = title
-> 1626     ax = embedding(
   1627         adata,
   1628         basis,
   1629         dimensions=np.array(components) - 1,  # Saved with 1 based indexing
   1630         color=density_col_name,
   1631         color_map=color_map,
   1632         size=dot_sizes,
   1633         vmax=vmax,
   1634         vmin=vmin,
   1635         vcenter=vcenter,
   1636         norm=norm,
   1637         save=False,
   1638         title=_title,
   1639         ax=ax,
   1640         show=False,
   1641         **kwargs,
   1642     )
   1643     axs.append(ax)
   1645 ax = axs

File ~/miniconda3/envs/mubind/lib/python3.9/site-packages/scanpy/plotting/_tools/scatterplots.py:394, in embedding(adata, basis, color, mask_obs, gene_symbols, use_raw, sort_order, edges, edges_width, edges_color, neighbors_key, arrows, arrows_kwds, groups, components, dimensions, layer, projection, scale_factor, color_map, cmap, palette, na_color, na_in_legend, size, frameon, legend_fontsize, legend_fontweight, legend_loc, legend_fontoutline, colorbar_loc, vmax, vmin, vcenter, norm, add_outline, outline_width, outline_color, ncols, hspace, wspace, title, show, save, ax, return_fig, marker, **kwargs)
    383         for s, c in [(bg_size, bg_color), (gap_size, gap_color)]:
    384             ax.scatter(
    385                 coords[:, 0],
    386                 coords[:, 1],
   (...)
    391                 **kwargs_outline,
    392             )
--> 394     cax = scatter(
    395         coords[:, 0],
    396         coords[:, 1],
    397         c=color_vector,
    398         rasterized=settings._vector_friendly,
    399         marker=marker[count],
    400         **kwargs_scatter,
    401     )
    403 # remove y and x ticks
    404 ax.set_yticks([])

File ~/miniconda3/envs/mubind/lib/python3.9/site-packages/matplotlib/__init__.py:1446, in _preprocess_data.<locals>.inner(ax, data, *args, **kwargs)
   1443 @functools.wraps(func)
   1444 def inner(ax, *args, data=None, **kwargs):
   1445     if data is None:
-> 1446         return func(ax, *map(sanitize_sequence, args), **kwargs)
   1448     bound = new_sig.bind(ax, *args, **kwargs)
   1449     auto_label = (bound.arguments.get(label_namer)
   1450                   or bound.kwargs.get(label_namer))

File ~/miniconda3/envs/mubind/lib/python3.9/site-packages/matplotlib/axes/_axes.py:4692, in Axes.scatter(self, x, y, s, c, marker, cmap, norm, vmin, vmax, alpha, linewidths, edgecolors, plotnonfinite, **kwargs)
   4688         keys_str = ", ".join(f"'{k}'" for k in extra_keys)
   4689         _api.warn_external(
   4690             "No data for colormapping provided via 'c'. "
   4691             f"Parameters {keys_str} will be ignored")
-> 4692 collection._internal_update(kwargs)
   4694 # Classic mode only:
   4695 # ensure there are margins to allow for the
   4696 # finite size of the symbols.  In v2.x, margins
   4697 # are present by default, so we disable this
   4698 # scatter-specific override.
   4699 if mpl.rcParams['_internal.classic_mode']:

File ~/miniconda3/envs/mubind/lib/python3.9/site-packages/matplotlib/artist.py:1223, in Artist._internal_update(self, kwargs)
   1216 def _internal_update(self, kwargs):
   1217     """
   1218     Update artist properties without prenormalizing them, but generating
   1219     errors as if calling `set`.
   1220
   1221     The lack of prenormalization is to maintain backcompatibility.
   1222     """
-> 1223     return self._update_props(
   1224         kwargs, "{cls.__name__}.set() got an unexpected keyword argument "
   1225         "{prop_name!r}")

File ~/miniconda3/envs/mubind/lib/python3.9/site-packages/matplotlib/artist.py:1197, in Artist._update_props(self, props, errfmt)
   1195             func = getattr(self, f"set_{k}", None)
   1196             if not callable(func):
-> 1197                 raise AttributeError(
   1198                     errfmt.format(cls=type(self), prop_name=k))
   1199             ret.append(func(v))
   1200 if ret:

AttributeError: PathCollection.set() got an unexpected keyword argument 'edge_colors'
print('here...')
notebook controller is DISPOSED.

View Jupyter <a href='command:jupyter.viewOutput'>log</a> for further details.
# test custom edge colors
sc.pl.embedding_density(ad, basis='umap', key='umap_density_dynamic_score_z1', group='dynamic', color_map='viridis', edge_colors='black')
                        # save="dynamic_scores_neurogenesis.pdf") # basis='umap', groupby='dynamic_score_cluster')
notebook controller is DISPOSED.

View Jupyter <a href='command:jupyter.viewOutput'>log</a> for further details.
rcParams['figure.figsize'] = 5, 5
rcParams['figure.dpi'] = 80
sc.pl.embedding_density(ad, basis='umap', key='umap_density_dynamic_score_z1', group='dynamic', color_map='viridis',
                        save="dynamic_scores_neurogenesis.pdf") # basis='umap', groupby='dynamic_score_cluster')
# plt.savefig(
notebook controller is DISPOSED.

View Jupyter <a href='command:jupyter.viewOutput'>log</a> for further details.
!readlink -f figures/dynamic_scores_neurogenesis.pdf
notebook controller is DISPOSED.

View Jupyter <a href='command:jupyter.viewOutput'>log</a> for further details.
rcParams['pdf.fonttype'] = 42
sc.pl.umap(rna_sample, color=cell_type_key, show=False)
plt.savefig("../../../output/annotation_neurogenesis.pdf")
notebook controller is DISPOSED.

View Jupyter <a href='command:jupyter.viewOutput'>log</a> for further details.
rcParams['pdf.fonttype'] = 42
scv.pl.velocity_embedding_stream(rna_sample, color=cell_type_key, save="../../../output/velocity_stream_neurogenesis")
notebook controller is DISPOSED.

View Jupyter <a href='command:jupyter.viewOutput'>log</a> for further details.