Dentate gyrus (scRNA-seq) | Model evaluation
Here we compared the weights learned by several model iterations, to highlight
Performance user parameter combinations
Interpretation based on TF regulators
Coherence or learned graph-weights when assisting RNA-weights, or only using ATAC-weights
%load_ext autoreload
%autoreload 2
cd ~/workspace/theislab/mubind/docs/notebooks/single_cell
/home/ilibarra/workspace/theislab/mubind/docs/notebooks/single_cell
/home/ilibarra/miniconda3/envs/mubind/lib/python3.9/site-packages/IPython/core/magics/osm.py:393: UserWarning: using bookmarks requires you to install the `pickleshare` library.
  bkms = self.shell.db.get('bookmarks', {})
/home/ilibarra/miniconda3/envs/mubind/lib/python3.9/site-packages/IPython/core/magics/osm.py:417: UserWarning: using dhist requires you to install the `pickleshare` library.
  self.shell.db['dhist'] = compress_dhist(dhist)[-100:]
!readlink -f .
/home/ilibarra/workspace/theislab/mubind/docs/notebooks/single_cell
import torch
import mubind as mb
import scanpy as sc
!ls -ltrh /home/ilibarra/workspace/theislab/mubind/docs/notebooks/single_cell/dentategyrus*
-rw-rw-r-- 1 ilibarra ilibarra 7.0M Aug  5 20:13 /home/ilibarra/workspace/theislab/mubind/docs/notebooks/single_cell/dentategyrus_use_logdynamic_0_obs2930.pth
-rw-rw-r-- 1 ilibarra ilibarra 8.6M Aug  5 20:13 /home/ilibarra/workspace/theislab/mubind/docs/notebooks/single_cell/dentategyrus_use_logdynamic_1_obs2930.pth
-rw-rw-r-- 1 ilibarra ilibarra 682M Aug  5 20:13 /home/ilibarra/workspace/theislab/mubind/docs/notebooks/single_cell/dentategyrus_sample_train_obs2930.h5ad
-rw-rw-r-- 1 ilibarra ilibarra  45M Aug  5 20:13 /home/ilibarra/workspace/theislab/mubind/docs/notebooks/single_cell/dentategyrus_train_dataloader_obs2930.pkl
# query
obs_id = 2930


# load models
model_by_logdynamic = {}
for use_logdynamic in [False, True]:
    p = 'dentategyrus_use_logdynamic_%i_obs%s.pth' % (use_logdynamic, obs_id)
    print(p)
    model_by_logdynamic[use_logdynamic] = torch.load(p)
dentategyrus_use_logdynamic_0_obs2930.pth
dentategyrus_use_logdynamic_1_obs2930.pth
ad = sc.read_h5ad('dentategyrus_sample_train_obs%s.h5ad' % obs_id)
# ad = sc.read_h5ad('atac_train.h5ad')
#rna_sample = sc.read_h5ad('rna_sample_train.h5ad')
rna_sample = ad
rna_sample.shape
(2930, 13187)
import pickle
train = pickle.load(open('dentategyrus_train_dataloader_obs%s.pkl' % obs_id, 'rb'))
%load_ext line_profiler
# # load the pancreas multiome dataset
# rna, atac = mb.datasets.pancreas_multiome() # data_directory='../../../annotations/scatac')
# %lprun -f model.forward model.optimize_iterative(train, n_epochs=10, skip_kernels=list([0]) + list(range(2, 500)), opt_kernel_shift=[0, 0] + [0] * (n_kernels), opt_kernel_length=[0, 0] + [0] * (n_kernels))
# %lprun -f model.binding_modes.forward model.optimize_iterative(train, n_epochs=10, skip_kernels=list([0]) + list(range(2, 500)), opt_kernel_shift=[0, 0] + [0] * (n_kernels), opt_kernel_length=[0, 0] + [0] * (n_kernels))
import matplotlib.pyplot as plt
for optimize_log_dynamic in model_by_logdynamic:
    model = model_by_logdynamic[optimize_log_dynamic]
    print(optimize_log_dynamic)
    from matplotlib import rcParams
    rcParams['figure.figsize'] = 20, 5
    rcParams['figure.dpi'] = 100
    mb.pl.logo(model, n_cols=3, show=True, n_rows=6, stop_at=4) #  log=True)
    plt.show()
False
break

True
break

for optimize_log_dynamic in model_by_logdynamic:
    if not optimize_log_dynamic:
        continue
    model = model_by_logdynamic[optimize_log_dynamic]
    print(optimize_log_dynamic)

    tsum = torch.sum
    texp = torch.exp
    tspa = torch.sparse_coo_tensor
    tsmm = torch.sparse.mm
    t = torch.transpose

    # connectivities
    C = model.graph_module.conn_sparse
    a_ind = C.indices()

    log_dynamic = model.graph_module.log_dynamic
    D = model.graph_module.log_dynamic
    D_tril = tspa(a_ind, D, C.shape)  # .requires_grad_(True).cuda()
    D_triu = tspa(a_ind, -D, C.shape)  # .requires_grad_(True).cuda()
    D = D_tril + t(D_triu, 0, 1)
    # log_dynamic = log_dynamic + -torch.transpose(log_dynamic, 0, 1)
    # triu_indices = torch.triu_indices(row=n_rounds, col=n_rounds, offset=1)
    D

    import seaborn as sns
    mb.pl.set_rcParams({'figure.figsize': [3, 3]})
    sns.heatmap(D.to_dense().detach().cpu(), cmap='RdBu_r')
    plt.show()
True
model = model_by_logdynamic[1]
mb.pl.set_rcParams({'figure.figsize': [12, 3], 'figure.dpi': 110})
plt.subplot(1, 4, 1)
plt.plot(model.loss_history_log_dynamic)
plt.ylabel('log dynamic loss')
plt.subplot(1, 4, 2)
plt.plot(model.loss_history)
plt.ylabel('overall loss')
plt.subplot(1, 4, 3)
plt.plot(model.loss_history_sym_weights)
plt.ylabel('similar weights loss')
plt.tight_layout()
plt.show()
import pandas as pd
import numpy as np
rcParams['figure.figsize'] = 3, 5
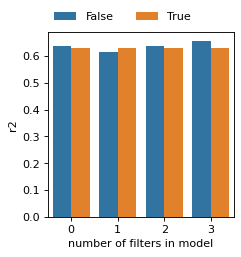
r2_all = []
for optimize_log_dynamic in model_by_logdynamic:
print(optimize_log_dynamic)
model = model_by_logdynamic[optimize_log_dynamic]
# contributions per newly added kernel
import seaborn as sns
if len(model.best_r2_by_new_filter) != 0:
r2 = pd.DataFrame(model.best_r2_by_new_filter, columns=['r2']).reset_index()
r2['opt_log_dynamic'] = optimize_log_dynamic
r2_all.append(r2)
if len(r2_all) > 0:
r2_all = pd.concat(r2_all)
rcParams['figure.figsize'] = 3, 3
rcParams['figure.dpi'] = 80
ax = sns.barplot(data=r2_all, x='index', y='r2', hue='opt_log_dynamic', )
sns.move_legend(ax, "lower center", bbox_to_anchor=(.4, 1), ncol=3, title=None, frameon=False)
plt.xlabel('number of filters in model')
plt.show()
False
True
model = model_by_logdynamic[True]
torch.set_printoptions(precision=2)
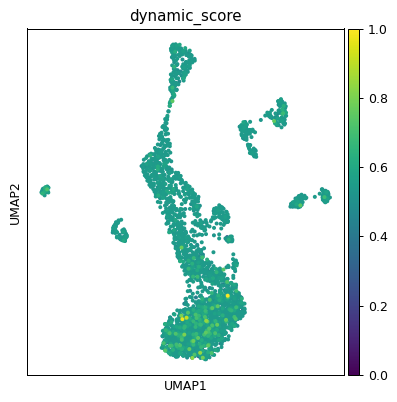
dynamic_score = D.to_dense().detach().cpu().sum(axis=0)
# dyn_score
dynamic_score = dynamic_score
dynamic_score = (dynamic_score - dynamic_score.min()) / (dynamic_score.max() - dynamic_score.min())
ad.obs['dynamic_score'] = dynamic_score
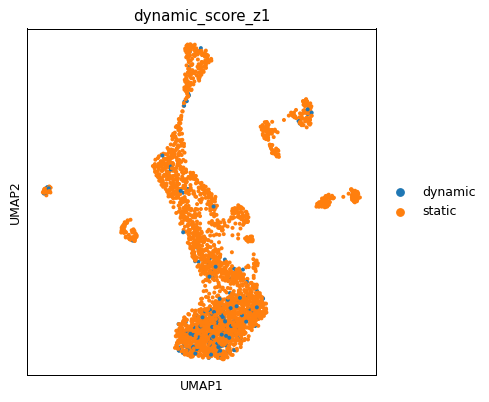
ad.obs['dynamic_score_cluster'] = np.where(dynamic_score > dynamic_score.mean(), 'dynamic', 'static')
z1 = np.where(((dynamic_score - dynamic_score.mean()) / dynamic_score.std()) > 1, 'dynamic', 'static')
z2 = np.where(((dynamic_score - dynamic_score.mean()) / dynamic_score.std()) > 2, 'dynamic', 'static')
ad.obs['dynamic_score_z1'] = z1
ad.obs['dynamic_score_z2'] = z2
ad.obs['dynamic_score'].describe()
count    2930.000000
mean        0.540680
std         0.053730
min         0.000000
25%         0.539971
50%         0.540680
75%         0.540709
max         1.000000
Name: dynamic_score, dtype: float64
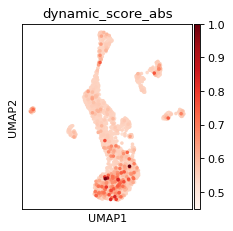
ad.obs['dynamic_score_abs'] = ad.obs['dynamic_score'].abs()
sc.pl.umap(ad, color='dynamic_score_abs', color_map='Reds', vmin=.45)
print('here...')
here...
pwd
'/home/ilibarra/workspace/theislab/mubind/docs/notebooks/single_cell'
rcParams['pdf.fonttype'] = 42
rcParams['figure.dpi'] = 150
rcParams['figure.figsize'] = 5, 5
# sns.set_context(rc={'axes.labelsize': 1})
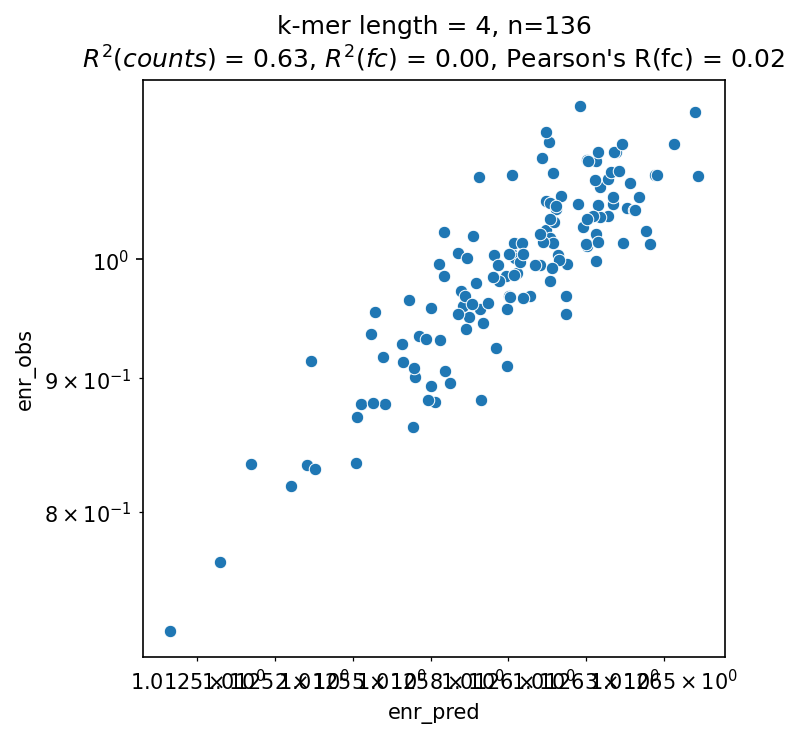
k = 4
scores = mb.pl.kmer_enrichment(model, train, style='scatter', k=k, show=False, log_scale=True)
print(scores)
# g.set_xticklabels(rotation=30, ha='right')
plt.xticks(rotation=45, ha='right')
# # plt.show()
# plt.tight_layout()
# plt.savefig('../../../output/dentategyrus_kmer_predictions_%i.pdf' % k)
# plt.close()
plotting...
{'r2_counts': 0.628903865814209, 'r2_foldchange': -0.0014495849609375, 'r2_enr': -0.04714012145996094, 'r2_fc': 0.00046788969679425563, 'pearson_foldchange': 0.021630758118805167}
(array([  0.1,   1. ,  10. , 100. ]),
 [Text(0.1, 0, '$\\mathdefault{10^{-1}}$'),
  Text(1.0, 0, '$\\mathdefault{10^{0}}$'),
  Text(10.0, 0, '$\\mathdefault{10^{1}}$'),
  Text(100.0, 0, '$\\mathdefault{10^{2}}$')])
!readlink -f ../../../output/dentategyrus_kmer_predictions.pdf
/home/ilibarra/workspace/theislab/mubind/output/dentategyrus_kmer_predictions.pdf
# contributions per newly added kernel
mb.pl.set_rcParams({'figure.figsize': [5, 5], 'figure.dpi': 90})
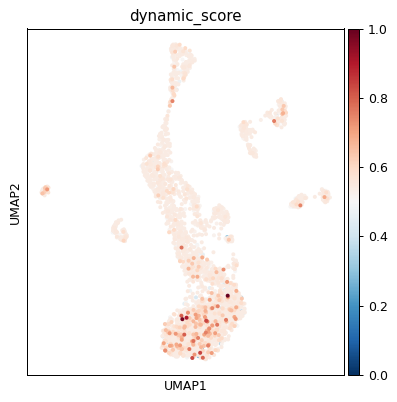
sc.pl.umap(ad, color=['dynamic_score'], cmap='RdBu_r', sort_order=True)
sc.pl.umap(ad, color=['dynamic_score_z1'], cmap='RdBu_r', sort_order=True)
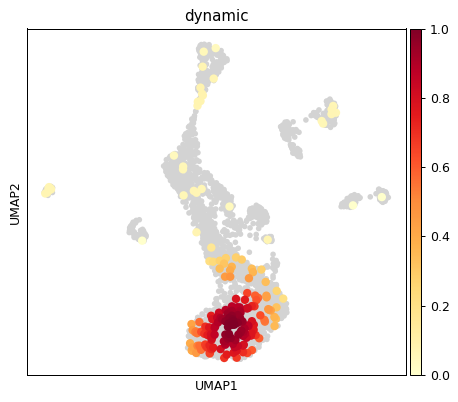
sc.tl.embedding_density(ad, basis='umap', groupby='dynamic_score_z1')
sc.pl.embedding_density(ad, basis='umap', key='umap_density_dynamic_score_z1', group='dynamic') # basis='umap', groupby='dynamic_score_cluster')
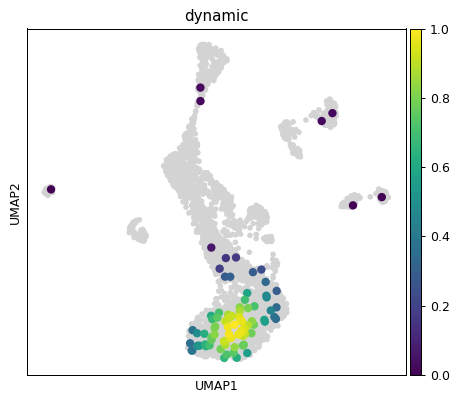
sc.tl.embedding_density(ad, basis='umap', groupby='dynamic_score_z2')
sc.pl.embedding_density(ad, basis='umap', key='umap_density_dynamic_score_z2', group='dynamic', color_map='viridis') # basis='umap', groupby='dynamic_score_cluster')
sc.pl.embedding_density(ad, basis='umap', key='umap_density_dynamic_score_z1', group='dynamic', save='dentategyrus_dynamic_red')
WARNING: saving figure to file figures/umap_density_dynamic_score_z1_dentategyrus_dynamic_red.pdf
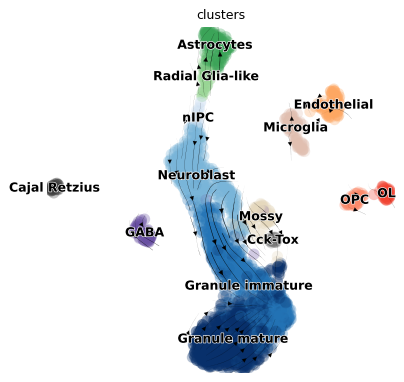
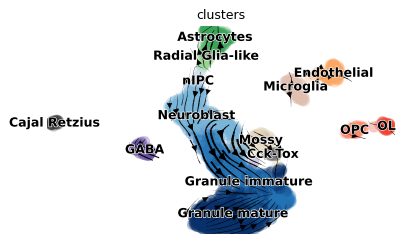
import scvelo as scv
scv.pl.velocity_embedding_stream(ad, save='dentategyrus_dynamic', arrow_size=.8, linewidth=.25)
saving figure to file ./figures/scvelo_dentategyrus_dynamic.pdf
import seaborn as sns
umap = ad.obsm['X_umap']
sns.histplot(x=umap[:, 0], y=umap[:, 1], bins=50, cmap='PiYG')
<Axes: >
plt.pcolormesh(
    np.histogram2d(umap[:, 0], umap[:, 1], bins=50)[0]
)
<matplotlib.collections.QuadMesh at 0x7dfb82393370>
x, y = np.meshgrid(umap[:, 0], umap[:, 1])
x = umap[:,1] # array_txt[:,0]
y = umap[:,1] # array_txt[:,1]
z = ad.obs['dynamic_score'].values # array_txt[:,2]
sc.pl.umap(ad, color='dynamic_score')
import matplotlib.pyplot as plt
import numpy as np
rcParams['figure.figsize'] = 5, 3

# generate 2 2d grids for the x & y bounds
y, x = np.meshgrid(np.linspace(-3, 3, 100), np.linspace(-3, 3, 100))
z = (1 - x / 2. + x ** 5 + y ** 3) * np.exp(-x ** 2 - y ** 2)
z = z[:-1, :-1]
z_min, z_max = -np.abs(z).max(), np.abs(z).max()
fig, ax = plt.subplots()
c = ax.pcolormesh(x, y, z, cmap='RdBu', vmin=z_min, vmax=z_max)
ax.set_title('pcolormesh')
# set the limits of the plot to the limits of the data
ax.axis([x.min(), x.max(), y.min(), y.max()])
fig.colorbar(c, ax=ax)

plt.show()
import itertools
import numpy as np

def grid(x, y, z, size_x=1, size_y=1):

    def pairwise(iterable):
        "s -> (s0,s1), (s1,s2), (s2, s3), ..."
        a, b = itertools.tee(iterable)
        next(b, None)
        return zip(a, b)

    minx, maxx = int(min(x)), int(max(x)) + 1
    miny, maxy = int(min(y)), int(max(y)) + 1

    result = []
    x_edges = pairwise(np.arange(minx, maxx + 1, size_x))
    for xleft, xright in x_edges:
        xmask = np.logical_and(x >= xleft, x < xright)
        y_edges = pairwise(np.arange(miny, maxy + 1, size_y))
        for yleft, yright in y_edges:
            ymask = np.logical_and(y >= yleft, y < yright)
            cell = z[np.logical_and(xmask, ymask)]
            result.append(cell.sum())

    result = np.array(result).reshape((maxx - minx, maxy - miny))
    return np.flip(result.T, 0)
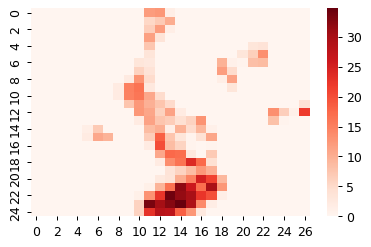
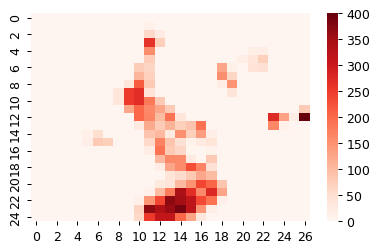
cell_type_key = 'clusters'
grid_dyn_score = grid(umap[:,0], umap[:,1], ad.obs['dynamic_score'], size_x=1, size_y=1)
grid_counts = grid(umap[:,0], umap[:,1], ad.obs[cell_type_key].cat.codes.values, size_x=1, size_y=1)
sns.heatmap(grid_dyn_score, cmap='Reds')
plt.show()
sns.heatmap(grid_counts, cmap='Reds')
plt.show()
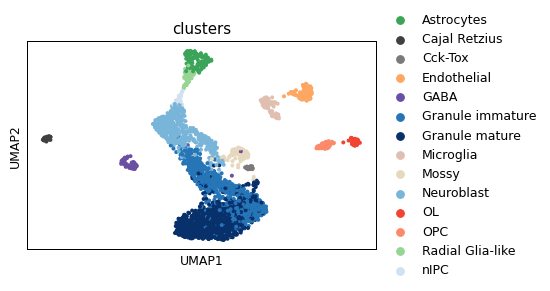
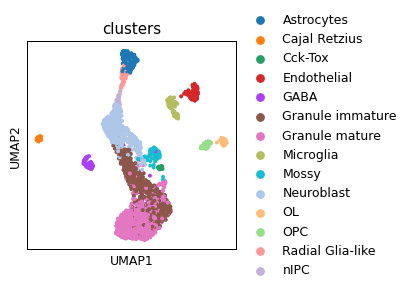
sc.pl.umap(ad, color=cell_type_key)
# for optimize_log_dynamic in model_by_logdynamic:
#     mb.pl.set_rcParams({'figure.figsize': [3, 3], 'figure.dpi': 90})
#     print(optimize_log_dynamic)
#     model = model_by_logdynamic[optimize_log_dynamic]
#     mb.pl.kmer_enrichment(model, train, log_scale=False, style='scatter', ylab='t1', xlab='p1', k=8)
#     plt.show()

#     mb.pl.set_rcParams({'figure.figsize': [10, 7], 'figure.dpi': 90})
#     mb.pl.logo(model,
#                title=False,
#                xticks=False,
#                rowspan_dinuc=0,
#                rowspan_mono=1,
#                n_rows=12,
#                n_cols=3,
#                stop_at=20) # n_cols=len(reduced_groups))
#     plt.show()
model = model_by_logdynamic[True]
G = model.graph_module.conn_sparse.detach().cpu().to_dense() # (C, C)
# number of non_zero weights
len(G[G != 0])
62308
# output = model(**inputs, use_conn=False, return_binding_scores=True)
print('here...')
here...
ad
AnnData object with n_obs × n_vars = 2930 × 13187
    obs: 'clusters', 'age(days)', 'clusters_enlarged', 'n_counts', 'velocity_self_transition', 'dynamic_score', 'dynamic_score_cluster', 'dynamic_score_z1', 'dynamic_score_z2', 'dynamic_score_abs', 'umap_density_dynamic_score_z1', 'umap_density_dynamic_score_z2'
    var: 'gene_count_corr', 'velocity_gamma', 'velocity_qreg_ratio', 'velocity_r2', 'velocity_genes', 'chrom', 'pos', 'strand', 'tss_start', 'tss_end', 'chromosome_name', 'k', 'acc_score', 'acc_score_rank', 'chr', 'summit.start', 'summit.end', 'k.summit'
    uns: 'clusters_colors', 'clusters_enlarged_colors', 'neighbors', 'pca', 'velocity_graph', 'velocity_graph_neg', 'velocity_params', 'dynamic_score_z1_colors', 'umap_density_dynamic_score_z1_params', 'umap_density_dynamic_score_z2_params'
    obsm: 'X_pca', 'X_umap', 'velocity_umap'
    varm: 'PCs'
    layers: 'Ms', 'Mu', 'ambiguous', 'spliced', 'unspliced', 'variance_velocity', 'velocity'
    obsp: 'connectivities', 'distances'
model = model.cuda()
device = torch.device("cuda:0" if torch.cuda.is_available() else "cpu")
# device = 'cpu'
# device
pwd
'/home/ilibarra/workspace/theislab/mubind/docs/notebooks/single_cell'
train
<torch.utils.data.dataloader.DataLoader at 0x7dfc7996a070>
for optimize_log_dynamic in model_by_logdynamic:
    print(optimize_log_dynamic)
    if not optimize_log_dynamic:
        continue
    model = model_by_logdynamic[optimize_log_dynamic].cuda()

    umap = ad.obsm['X_umap'].copy()
    umap = np.sort(umap, 0)

    x = umap[:,0]
    y = umap[:,1]
    X, Y = np.meshgrid(x, y)

    n_points = x.shape[0]
    # x-component to the right
    u = np.ones((n_points, n_points))
    # y-component zero
    v = np.zeros((n_points, n_points))

    pred = []
    for i, batch in enumerate(train):
        # Get a batch and potentially send it to GPU memory.
        mononuc = batch["mononuc"].to(device)
        # print(i, mononuc.shape)
        b = batch["batch"].to(device) if "batch" in batch else None
        rounds = batch["rounds"].to(device) if "rounds" in batch else None
        countsum = batch["countsum"].to(device) if "countsum" in batch else None
        seq = batch["seq"] if "seq" in batch else None
        residues = batch["residues"].to(device) if "residues" in batch else None
        if residues is not None and train.dataset.store_rev:
            mononuc_rev = batch["mononuc_rev"].to(device)
            inputs = {"mono": mononuc, "mono_rev": mononuc_rev, "batch": b, "countsum": countsum,
                      "residues": residues}
        elif residues is not None:
            inputs = {"mono": mononuc, "batch": b, "countsum": countsum, "residues": residues}
        elif train.dataset.store_rev:
            mononuc_rev = batch["mononuc_rev"].to(device)
            inputs = {"mono": mononuc, "mono_rev": mononuc_rev, "batch": b, "countsum": countsum}
        else:
            inputs = {"mono": mononuc, "batch": b, "countsum": countsum}

        inputs['scale_countsum'] = model.datatype == 'selex'


        output = model(**inputs, use_conn=False, return_binding_scores=True)

        output = output.cpu().detach().numpy()
        print('here...')
        print(output.shape)

        print(output.sum())
        pred.append(output)

    # pred = np.concatenate(pred).T

    binding_scores = np.concatenate(pred).T


    # ad.layers['velocity'] = pred

    # conn = model.graph_module.conn_sparse.detach().cpu()
    # conn = model.graph_module.conn_sparse.detach().cpu().to_dense()
    # v = conn.sum(axis=1)
    # ad.layers['velocity'] = torch.stack([v,] * ad.shape[1], axis=1).numpy()

    # ad.layers['counts'] = ad.X

    # mb.pl.set_rcParams({'figure.figsize': [5, 4], 'figure.dpi': 90})
    # plt.hist(model.graph_module.conn_sparse.values().detach().cpu().numpy())
    # plt.show()

    # import scvelo as scv

    # sc.pp.neighbors(ad)

    # # scv.tl.velocity_graph(ad, vkey='velocity', xkey='counts')
    # # ad.layers['velocity'] = ad.obs['dynamic_score']

    # scv.tl.velocity_graph(ad, vkey='velocity', xkey='counts')
    # ax = scv.pl.velocity_embedding_stream(ad, color='celltype', show=False) #  X_grid='X_umap', V=V)


X = ad.X.A
G @ binding_scores
np.random.shuffle(binding_scores)
False
True
here...
(128, 2930)
2856046800000.0
here...
(128, 2930)
2353553000000.0
here...
(128, 2930)
1396651700000.0
here...
(128, 2930)
1563507800000.0
here...
(128, 2930)
2185263300000.0
here...
(128, 2930)
2274207500000.0
here...
(128, 2930)
2094323600000.0
here...
(128, 2930)
1651934200000.0
here...
(128, 2930)
2181155100000.0
here...
(128, 2930)
3143311000000.0
here...
(128, 2930)
2227194300000.0
here...
(128, 2930)
3339283300000.0
here...
(128, 2930)
1831032800000.0
here...
(128, 2930)
1814699600000.0
here...
(128, 2930)
2477105600000.0
here...
(128, 2930)
1907320800000.0
here...
(128, 2930)
2868307600000.0
here...
(128, 2930)
2056490200000.0
here...
(128, 2930)
2661629600000.0
here...
(128, 2930)
1678149400000.0
here...
(128, 2930)
1242123700000.0
here...
(128, 2930)
1851048300000.0
here...
(114, 2930)
2316472200000.0
import scvelo as scv
ad.shape, binding_scores.shape
((2930, 13187), (2930, 2930))
binding_scores
array([[7349828. , 7286087. , 7234309. , ..., 7125250. , 6769667.5,
        7019276.5],
       [7282303.5, 7180440.5, 7143005. , ..., 6988419. , 6666299. ,
        6872696.5],
       [7320444. , 7240102.5, 7192665. , ..., 7035899. , 6707566.5,
        6925640.5],
       ...,
       [7303637. , 7216828. , 7173559.5, ..., 7046850.5, 6711989. ,
        6936129.5],
       [7250796. , 7156067.5, 7115549.5, ..., 6989981. , 6670038. ,
        6879278. ],
       [7307043. , 7205868. , 7167688. , ..., 7001323. , 6678960.5,
        6888087. ]], dtype=float32)
# ad
# ad.layers['velocity'] = binding_scores
# scv.tl.velocity_graph(ad, vkey='velocity', xkey='counts')
# ax = scv.pl.velocity_embedding_stream(ad, color='celltype', show=False) #  X_grid='X_umap', V=V)
np.random.shuffle(binding_scores)
binding_scores
array([[7323232. , 7227626.5, 7190169. , ..., 7096780.5, 6762414. ,
        6995179. ],
       [7290506.5, 7187533.5, 7150198. , ..., 7002432. , 6680542. ,
        6890408.5],
       [7315332. , 7218604. , 7178159.5, ..., 7024021.5, 6705326.5,
        6919555.5],
       ...,
       [7310829. , 7237692. , 7186746. , ..., 7065545.5, 6724169. ,
        6949687. ],
       [7292523.5, 7213102.5, 7166607. , ..., 7041639. , 6705236. ,
        6928228.5],
       [7241585. , 7127106. , 7094303. , ..., 6952339. , 6644497. ,
        6841124.5]], dtype=float32)
try:
    scv.pl.velocity_embedding_stream(rna_sample, color=cell_type_key)
except Exception:
    print("sample too small.")
# np.random.shuffle(binding_scores)
# ad.layers['velocity'] = binding_scores
# scv.tl.velocity_graph(ad, vkey='velocity', xkey='counts')
# ax = scv.pl.velocity_embedding_stream(ad, color='celltype', show=False) #  X_grid='X_umap', V=V)
import seaborn as sns
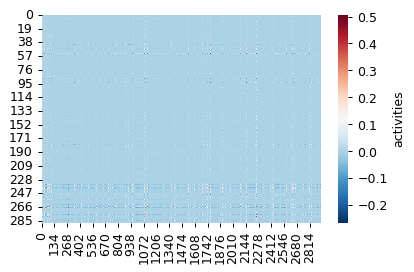
act = model.get_log_activities().detach().cpu().squeeze(0)
sns.heatmap(act, cmap='RdBu_r', cbar_kws={'label': 'activities'})
<Axes: >
# anno[anno['Name'] == 'NR/20']
# clu[clu['Cluster_ID'] == 248]
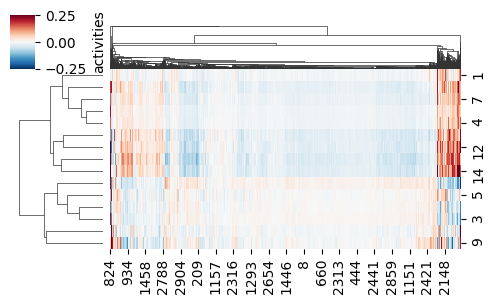
# highlight the top-n filters per cell, with the top variability
rcParams['figure.dpi'] = 100
n_show = 15
print(act.var(axis=1).sort()[1][-n_show:])
act_sel = act[act.var(axis=1).sort()[1][-n_show:],:]
vmax = act_sel.abs().max()
sns.clustermap(act_sel,
               vmin=-vmax / 2, vmax=vmax / 2,
               cmap='RdBu_r',

               cbar_kws={'label': 'activities'},
               figsize=[5, 3])
tensor([ 94, 179, 240, 252, 256,  93,  41, 285,  53, 265, 263, 239, 235, 267,
        276])
<seaborn.matrix.ClusterGrid at 0x7dfb87644af0>
rna_sample.layers['velocity'].shape, rna_sample.shape
((2930, 13187), (2930, 13187))
# scv.pl.velocity_graph(rna_sample)
# ax = scv.pl.velocity_embedding_stream(ad,
#                                       color='celltype',
#                                       # density=2,
#                                       arrow_color='black',
#                                       n_neighbors=15) # show=False) #  X_grid='X_umap', V=V)
# ax = scv.pl.velocity_embedding_stream(ad, color='celltype', density=2, arrow_color='black', n_neighbors=15) # show=False) # X_grid='X_umap', V=V)
# scv.pl.velocity_embedding_stream(ad, color='celltype', n_neighbors=15) # X_grid='X_umap', V=V)
Study the asssociations betweeen obtained weights and cluster-specific transcription factors
Load information from archetypes DB (Vierstra et al 2020)
rna_sample, ad.shape
(AnnData object with n_obs × n_vars = 2930 × 13187
     obs: 'clusters', 'age(days)', 'clusters_enlarged', 'n_counts', 'velocity_self_transition', 'dynamic_score', 'dynamic_score_cluster', 'dynamic_score_z1', 'dynamic_score_z2', 'dynamic_score_abs', 'umap_density_dynamic_score_z1', 'umap_density_dynamic_score_z2'
     var: 'gene_count_corr', 'velocity_gamma', 'velocity_qreg_ratio', 'velocity_r2', 'velocity_genes', 'chrom', 'pos', 'strand', 'tss_start', 'tss_end', 'chromosome_name', 'k', 'acc_score', 'acc_score_rank', 'chr', 'summit.start', 'summit.end', 'k.summit'
     uns: 'clusters_colors', 'clusters_enlarged_colors', 'neighbors', 'pca', 'velocity_graph', 'velocity_graph_neg', 'velocity_params', 'dynamic_score_z1_colors', 'umap_density_dynamic_score_z1_params', 'umap_density_dynamic_score_z2_params'
     obsm: 'X_pca', 'X_umap', 'velocity_umap'
     varm: 'PCs'
     layers: 'Ms', 'Mu', 'ambiguous', 'spliced', 'unspliced', 'variance_velocity', 'velocity'
     obsp: 'connectivities', 'distances',
 (2930, 13187))
rna_sel = rna_sample # rna[rna.obs_names.isin(ad.obs_names),:].copy()
rna_sel.shape
(2930, 13187)
pwd
'/home/ilibarra/workspace/theislab/mubind/docs/notebooks/single_cell'
import bindome as bd
bd.constants.ANNOTATIONS_DIRECTORY = 'annotations'

anno = mb.datasets.archetypes_anno()
rna_sel.shape
anno.sort_values('Cluster_ID')
| Cluster_ID | Name | DBD | Seed_motif | Total_width | Consensus_left | Consensus_right | Cluster_size | |
|---|---|---|---|---|---|---|---|---|
| 61 | 1 | HD/1 | homeodomain | LHX6_homeodomain_3 | 12 | 0 | 12 | 2 |
| 72 | 2 | HD/2 | homeodomain | ALX3_MA0634.1 | 26 | 8 | 16 | 186 |
| 79 | 3 | HD/3 | homeodomain | VENTX_homeodomain_2 | 21 | 3 | 20 | 1 |
| 80 | 4 | HD/4 | homeodomain | BARX1_MOUSE.H11MO.0.C | 17 | 5 | 13 | 17 |
| 81 | 5 | HD/5 | homeodomain | BARX1_homeodomain_1 | 21 | 2 | 18 | 6 |
| ... | ... | ... | ... | ... | ... | ... | ... | ... |
| 163 | 282 | PAX/2 | PAX | PAX5_HUMAN.H11MO.0.A | 24 | 4 | 21 | 3 |
| 161 | 283 | PAX-halfsite | PAX | Pax2_MA0067.1 | 8 | 1 | 7 | 1 |
| 0 | 284 | AHR | bHLH | AHR_HUMAN.H11MO.0.B | 9 | 2 | 8 | 3 |
| 105 | 285 | KLF/SP/3 | C2H2 | KLF8_HUMAN.H11MO.0.C | 9 | 0 | 9 | 2 |
| 285 | 286 | ZSCAN4 | C2H2 | ZSCAN4_C2H2_1 | 15 | 1 | 14 | 2 |
286 rows × 8 columns
ad.obs
| clusters | age(days) | clusters_enlarged | n_counts | velocity_self_transition | dynamic_score | dynamic_score_cluster | dynamic_score_z1 | dynamic_score_z2 | dynamic_score_abs | umap_density_dynamic_score_z1 | umap_density_dynamic_score_z2 | |
|---|---|---|---|---|---|---|---|---|---|---|---|---|
| index | ||||||||||||
| AAACATACCCATGA | Granule immature | 35 | Granule-immature | 2460.500000 | 0.051353 | 0.240400 | static | static | static | 0.240400 | 0.904131 | 0.889691 |
| AAACATACCGTAGT | Radial Glia-like | 12 | Radial Glia-like | 2460.499756 | 0.220968 | 0.365605 | static | static | static | 0.365605 | 0.130252 | 0.120899 |
| AAACATACGAGAGC | Granule mature | 35 | Granule-mature | 2460.499756 | 0.069691 | 0.791789 | dynamic | dynamic | dynamic | 0.791789 | 0.674206 | 0.614487 |
| AAACATACTGAGGG | Granule immature | 12 | Granule-immature | 2460.500000 | 0.080728 | 0.592427 | dynamic | static | static | 0.592427 | 0.333817 | 0.308805 |
| AAACATTGGCATCA | Granule immature | 35 | Granule-immature | 2460.500000 | 0.119560 | 0.569801 | dynamic | static | static | 0.569801 | 0.909646 | 0.901201 |
| ... | ... | ... | ... | ... | ... | ... | ... | ... | ... | ... | ... | ... |
| TTTCTACTTCCCGT | Granule immature | 35 | Granule-immature | 2460.500000 | 0.034482 | 0.536359 | static | static | static | 0.536359 | 0.397510 | 0.374104 |
| TTTGACTGCCTGTC | Neuroblast | 12 | Neuroblast 2 | 2460.499756 | 0.131426 | 0.532400 | static | static | static | 0.532400 | 0.295933 | 0.274872 |
| TTTGACTGTCTGGA | Granule mature | 35 | Granule-mature | 2460.499756 | 0.100035 | 0.626570 | dynamic | dynamic | static | 0.626570 | 0.854801 | 0.758780 |
| TTTGCATGGGAGTG | Microglia | 35 | Microglia | 2460.500244 | 0.284692 | 0.552120 | dynamic | static | static | 0.552120 | 0.077743 | 0.060119 |
| TTTGCATGTTCTTG | Granule immature | 35 | Granule-immature | 2460.499756 | 0.189407 | 0.683801 | dynamic | dynamic | dynamic | 0.683801 | 0.320551 | 0.341392 |
2930 rows × 12 columns
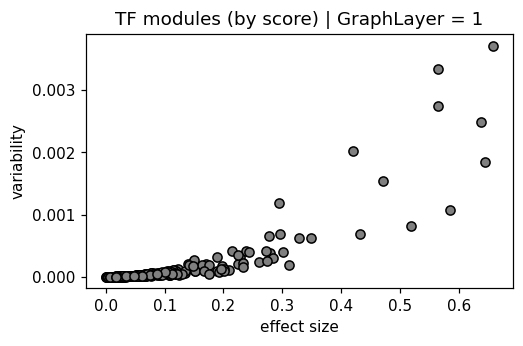
for optimize_log_dynamic in model_by_logdynamic:
    print(optimize_log_dynamic)
    model = model_by_logdynamic[optimize_log_dynamic]
    log_act = torch.stack(list(model.activities.log_activities), dim=1).squeeze(0)
    log_act = pd.DataFrame(log_act.detach().cpu().numpy())
    # log_act.columns = anno['Seed_motif'][2]
    # log_act.columns = ['intercept', 'dinuc_bias'] + list(anno['Seed_motif'].values)
    log_act.index = ad.obs_names
    ad.obsm["mubind_activities"] = log_act

    mb.pl.set_rcParams({"figure.figsize": [5, 3], "figure.dpi": 110})
    delta = log_act.max(axis=0) - log_act.min(axis=0)
    var = log_act.var(axis=0)
    plt.scatter(delta, var, color="gray", edgecolors="black")
    plt.xlabel("effect size")
    plt.ylabel("variability")
    plt.title("TF modules (by score) | GraphLayer = %i" % optimize_log_dynamic)
    plt.show()
False
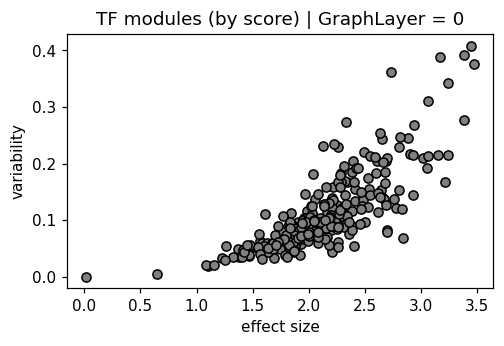
True
# unique names for annotation
names = anno['Name'] # .sort_values('Name')
added = dict()
new_name = []
for name in names:
    if not name in added:
        new_name.append(name)
        added[name] = 0
    else:
        new_name.append(name + '_%i' % added[name])
        added[name] += 1
anno['Name_unique'] = new_name
from scipy.stats import spearmanr
res = []
for optimize_log_dynamic in model_by_logdynamic:
if not optimize_log_dynamic:
continue
model = model_by_logdynamic[optimize_log_dynamic]
log_act = torch.stack(list(model.activities.log_activities), dim=1).squeeze(0)
log_act = pd.DataFrame(log_act.detach().cpu().numpy())
# log_act.columns = anno['Seed_motif'][2]
log_act.columns = ['intercept', 'dinuc_bias'] + list(range(1, 287))
log_act.index = ad.obs_names
ad.obsm['mubind_activities'] = log_act
mb.pl.set_rcParams({'figure.figsize': [5, 3], 'figure.dpi': 90})
delta = (log_act.max(axis=0) - log_act.min(axis=0))
var = log_act.var(axis=0)
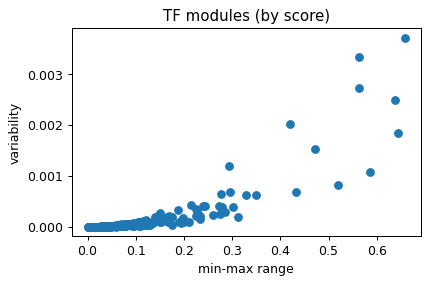
plt.scatter(delta, var)
plt.xlabel('min-max range')
plt.ylabel('variability')
plt.title('TF modules (by score)')
plt.show()
for c in log_act:
a = log_act[c]
b = ad.obs['dynamic_score'].values
# print(a.shape, b.shape)
res.append([optimize_log_dynamic, c] + list(spearmanr(a, b)))
res = pd.DataFrame(res, columns=['opt_log_dynamic', 'archetype_id', 'spearman', 'p_val'])
# add archetypes name
meta = pd.DataFrame(pd.concat([delta, var], axis=1))
meta.columns = ['max_effect', 'variability']
meta['name'] = ['intercept', 'dinuc_bias'] + list(range(1, 287))
clu = mb.datasets.archetypes_clu()
meta['archetypes_name'] = meta['name'].map(anno.set_index('Cluster_ID')['Name_unique'])
meta['archetypes_name'] = np.where(pd.isnull(meta['archetypes_name']), meta['name'], meta['archetypes_name'])

meta['archetypes_seed'] = meta['name'].map(anno.set_index('Cluster_ID')['Seed_motif'])

meta['filter_position'] = range(0, meta.shape[0])
meta = meta.sort_values('max_effect', ascending=0)
meta

res = res.merge(meta, left_on='archetype_id', right_on='name')
res = res.sort_values('p_val', ascending=True)
name_by_filter_id = meta['archetypes_name'].to_dict()
# name_by_filter_id
Observe general scores per case
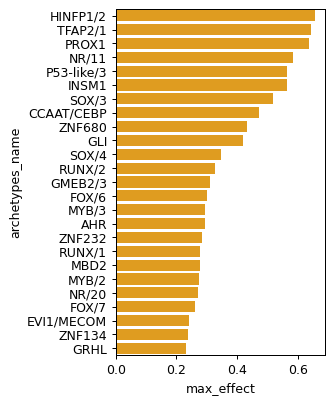
rcParams['figure.figsize'] =3, 5
sns.barplot(data=res.sort_values('max_effect', ascending=False).head(25), x='max_effect', y='archetypes_name', color='orange')
<Axes: xlabel='max_effect', ylabel='archetypes_name'>
res
| opt_log_dynamic | archetype_id | spearman | p_val | max_effect | variability | name | archetypes_name | archetypes_seed | filter_position | |
|---|---|---|---|---|---|---|---|---|---|---|
| 191 | True | 190 | -0.076029 | 0.000038 | 0.024365 | 2.065874e-06 | 190 | SOX/6 | SOX10_HMG_2 | 191 |
| 93 | True | 92 | 0.074626 | 0.000053 | 0.518763 | 8.181830e-04 | 92 | SOX/3 | SOX10_HMG_4 | 93 |
| 24 | True | 23 | -0.066684 | 0.000304 | 0.048784 | 7.841250e-06 | 23 | CPEB1 | CPEB1_RRM_1 | 24 |
| 260 | True | 259 | -0.063663 | 0.000565 | 0.075365 | 2.336398e-05 | 259 | TFCP2 | TF2L1_MOUSE.H11MO.0.C | 260 |
| 4 | True | 3 | -0.063177 | 0.000622 | 0.008669 | 3.192534e-07 | 3 | HD/3 | VENTX_homeodomain_2 | 4 |
| ... | ... | ... | ... | ... | ... | ... | ... | ... | ... | ... |
| 122 | True | 121 | 0.001143 | 0.950702 | 0.024825 | 1.376122e-06 | 121 | ZNF354 | Z354A_HUMAN.H11MO.0.C | 122 |
| 51 | True | 50 | -0.001060 | 0.954259 | 0.036326 | 3.853280e-06 | 50 | CREB/ATF/2 | ATF7_MA0834.1 | 51 |
| 214 | True | 213 | 0.001000 | 0.956844 | 0.035054 | 2.194194e-06 | 213 | ZNF524 | ZNF524_C2H2_1 | 214 |
| 35 | True | 34 | 0.000572 | 0.975297 | 0.050917 | 8.763278e-06 | 34 | NR/5 | THRA_nuclearreceptor_1 | 35 |
| 137 | True | 136 | 0.000523 | 0.977433 | 0.077538 | 1.438999e-05 | 136 | ZNF708 | ZN708_HUMAN.H11MO.0.C | 137 |
288 rows × 10 columns
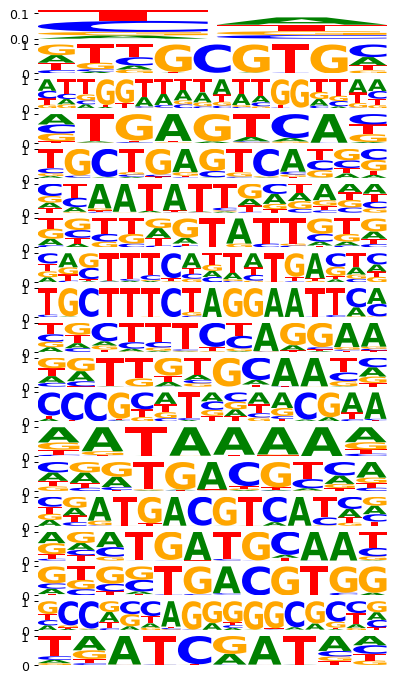
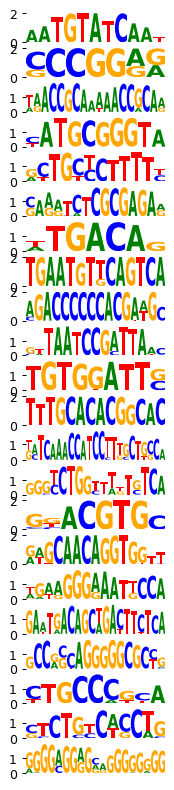
# visualize the logos as obtained by the model in each step
mb.pl.set_rcParams({'figure.figsize': [5, 20], 'figure.dpi': 90})
mb.pl.logo(model, title=False, xticks=False, rowspan_dinuc=0, rowspan_mono=1, n_rows=40, n_cols=1, stop_at=20)
           # n_rows=len(res.head(20).index),
break
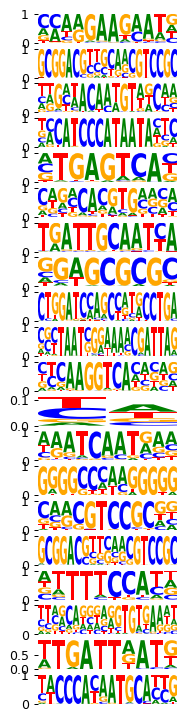
mb.pl.set_rcParams({'figure.figsize': [2, 20], 'figure.dpi': 90})
mb.pl.logo(model, title=False, xticks=False, rowspan_dinuc=0, rowspan_mono=1, n_rows=40,
           # n_rows=len(res.head(20).index),
           n_cols=1, order=res.head(20).index) # n_cols=len(reduced_groups))
plt.tight_layout()
plt.show()
<Figure size 180x1800 with 0 Axes>
import resource
print('total GB used:', resource.getrusage(resource.RUSAGE_SELF).ru_maxrss / 1e6)
total GB used: 2.439512
# for k in ad.obsm['log_activities'].iloc[:,2:]:
#     ad.obs[str(k)] = ad.obsm['log_activities'][k]
# sc.pl.umap(ad, color=map(str, ad.obsm['log_activities'].iloc[:,2:]), cmap='Reds')
rna_sel.obsm['X_umap'] = ad.obsm['X_umap']
def find_varname(ad, k, shuffle=False):
    if not shuffle:
        return ad.var_names[ad.var_names.str.upper().str.startswith(k.upper())]
    else:
        ad_sel = ad.var_names[ad.var_names.str.upper().str.startswith(k.upper())]
        return pd.Series(ad.var_names).sample(ad_sel.shape[0]).values
from scipy.stats import spearmanr, pearsonr
Calculate global correlations between the activities obtained per motif and gene-specific expression
all_targets = set()
for optimize_log_dynamic in model_by_logdynamic:
    print(optimize_log_dynamic)
    model = model_by_logdynamic[optimize_log_dynamic]

    log_act = torch.stack(list(model.activities.log_activities), dim=1).squeeze(0)
    log_act = pd.DataFrame(log_act.detach().cpu().numpy())
    log_act.index = ad.obs_names

    ad.obsm['log_activities'] = log_act
    ad.obsm['log_activities'].columns = ['intercept', 'dinuc_bias'] + list(range(1, 287))

    # collect all targets
    for k in ad.obsm['log_activities'].iloc[:,2:]:
        log_act = ad.obsm['log_activities'][k].values
        names = set()
        clu_sel = clu[clu['Cluster_ID'] == k]['Motif']
        for g in clu_sel:
            names.add(g.split('_')[0].split('.')[0].split('+')[0].upper())
        for g in anno[anno['Cluster_ID'] == k]['Seed_motif']:
            names.add(g.split('_')[0].split('.')[0])
        # print(k, names)
        targets = set()
        for name in names:
            target = find_varname(rna_sel, name)
            for t in target:
                all_targets.add(t)
        if len(targets) > 0 and False:
            sc.pl.umap(rna_sel, color=targets, cmap='Reds')
False
True
def get_act_gene_corr(model_by_logdynamic,
                      shuffle=False,
                      random_state=0,
                      query_cluster_id=None):
    print('association between motif activities and related TF targets (shuffle = %i)' % shuffle)
    res = []
    # print(len(all_targets))

    rna_sel_df = rna_sel.to_df()

    for optimize_log_dynamic in model_by_logdynamic:
        print('use GraphLayer = %i' % optimize_log_dynamic)
        model = model_by_logdynamic[optimize_log_dynamic]

        log_act = torch.stack(list(model.activities.log_activities), dim=1).squeeze(0)
        log_act = pd.DataFrame(log_act.detach().cpu().numpy())
        log_act.index = ad.obs_names

        ad.obsm['log_activities'] = log_act
        ad.obsm['log_activities'].columns = ['intercept', 'dinuc_bias'] + list(range(1, 287))

        if shuffle:
            random_cols = ad.obsm['log_activities'].iloc[:,2:].columns.values
            np.random.shuffle(random_cols)
            # random_cols

        for ki, k in enumerate(ad.obsm['log_activities'].iloc[:,2:]):
            next_log_act = ad.obsm['log_activities'][k].values

            # if shuffle:
            #     next_log_act = ad.obsm['log_activities'][random_cols[ki]].values

            # print(ki)
            # if ki % 30 == 0:
            #     print(ki)
            if query_cluster_id is not None and k != query_cluster_id:
                continue

            names = set()
            clu_sel = clu[clu['Cluster_ID'] == k]['Motif']

            for g in clu_sel:
                names.add(g.split('_')[0].split('.')[0].split('+')[0].upper())
            for g in anno[anno['Cluster_ID'] == k]['Seed_motif']:
                names.add(g.split('_')[0].split('.')[0])
            # print(k, names)
            next_targets = set()
            for name in names:
                if len(name) <= 2:
                    continue
                target = find_varname(rna_sel, name, shuffle=shuffle)
                # print(name, target)
                for t in target:
                    next_targets.add(t)

            # for t in all_targets:
            for t in set(all_targets).intersection(next_targets):
                gex = rna_sel_df[[t]].to_numpy() # rna_sel_df[t].A
                assert gex.shape[1] == 1
                gex = gex.flatten()
                # print(next_log_act.shape, gex.shape)
                # print(t, pearsonr(next_log_act, gex))
                res.append([ki, optimize_log_dynamic, k, t, t in next_targets] +
                        list(spearmanr(next_log_act, gex)))

    res = pd.DataFrame(res, columns=['filter_id', 'opt_log_dynamic', 'archetype_id', 'gene_name', 'matched', 'spearman', 'p_val'])

    # p-values
    res['module_name'] = res['archetype_id'].map(anno.set_index('Cluster_ID')['Name'].to_dict())
    res['p_val'] = np.where(pd.isnull(res['p_val']), 1.0, res['p_val'])

    # p-val adjust
    from statsmodels.stats.multitest import fdrcorrection
    res['p_adj'] = fdrcorrection(res['p_val'])[1]
    return res
anno[anno['Name'] == 'NR/20']
| Cluster_ID | Name | DBD | Seed_motif | Total_width | Consensus_left | Consensus_right | Cluster_size | Name_unique | |
|---|---|---|---|---|---|---|---|---|---|
| 145 | 248 | NR/20 | nuclearreceptor | ANDR_MOUSE.H11MO.0.A | 17 | 2 | 16 | 13 | NR/20 |
res = get_act_gene_corr(model_by_logdynamic) #  query_cluster_id=248)
shuffled = [get_act_gene_corr(model_by_logdynamic, shuffle=1, random_state=i, query_cluster_id=69) for i in range(10)]
association between motif activities and related TF targets (shuffle = 0)
use GraphLayer = 0
use GraphLayer = 1
association between motif activities and related TF targets (shuffle = 1)
use GraphLayer = 0
use GraphLayer = 1
association between motif activities and related TF targets (shuffle = 1)
use GraphLayer = 0
use GraphLayer = 1
association between motif activities and related TF targets (shuffle = 1)
use GraphLayer = 0
use GraphLayer = 1
association between motif activities and related TF targets (shuffle = 1)
use GraphLayer = 0
use GraphLayer = 1
association between motif activities and related TF targets (shuffle = 1)
use GraphLayer = 0
use GraphLayer = 1
association between motif activities and related TF targets (shuffle = 1)
use GraphLayer = 0
use GraphLayer = 1
association between motif activities and related TF targets (shuffle = 1)
use GraphLayer = 0
use GraphLayer = 1
association between motif activities and related TF targets (shuffle = 1)
use GraphLayer = 0
use GraphLayer = 1
association between motif activities and related TF targets (shuffle = 1)
use GraphLayer = 0
use GraphLayer = 1
association between motif activities and related TF targets (shuffle = 1)
use GraphLayer = 0
use GraphLayer = 1
res
| filter_id | opt_log_dynamic | archetype_id | gene_name | matched | spearman | p_val | module_name | p_adj | |
|---|---|---|---|---|---|---|---|---|---|
| 0 | 0 | False | 1 | Lhx6 | True | 0.003881 | 0.833671 | HD/1 | 0.928214 |
| 1 | 1 | False | 2 | Emx2 | True | -0.021974 | 0.234416 | HD/2 | 0.382166 |
| 2 | 1 | False | 2 | Dlx1 | True | -0.013717 | 0.457973 | HD/2 | 0.628372 |
| 3 | 1 | False | 2 | Lhx6 | True | -0.023791 | 0.197949 | HD/2 | 0.334252 |
| 4 | 1 | False | 2 | Dlx5 | True | -0.039445 | 0.032758 | HD/2 | 0.083405 |
| ... | ... | ... | ... | ... | ... | ... | ... | ... | ... |
| 1459 | 277 | True | 278 | Gmeb2 | True | 0.017925 | 0.332067 | GMEB2/3 | 0.495347 |
| 1460 | 280 | True | 281 | Pax6 | True | -0.058318 | 0.001588 | PAX/1 | 0.006789 |
| 1461 | 280 | True | 281 | Pax6os1 | True | -0.027405 | 0.138059 | PAX/1 | 0.255201 |
| 1462 | 283 | True | 284 | Ahr | True | 0.011032 | 0.550544 | AHR | 0.711291 |
| 1463 | 284 | True | 285 | Klf8 | True | -0.000245 | 0.989422 | KLF/SP/3 | 1.000000 |
1464 rows × 9 columns
res = get_act_gene_corr(model_by_logdynamic)
shuffled = [get_act_gene_corr(model_by_logdynamic, shuffle=1, random_state=i) for i in range(10)]
association between motif activities and related TF targets (shuffle = 0)
use GraphLayer = 0
use GraphLayer = 1
association between motif activities and related TF targets (shuffle = 1)
use GraphLayer = 0
use GraphLayer = 1
association between motif activities and related TF targets (shuffle = 1)
use GraphLayer = 0
use GraphLayer = 1
association between motif activities and related TF targets (shuffle = 1)
use GraphLayer = 0
use GraphLayer = 1
association between motif activities and related TF targets (shuffle = 1)
use GraphLayer = 0
use GraphLayer = 1
association between motif activities and related TF targets (shuffle = 1)
use GraphLayer = 0
use GraphLayer = 1
association between motif activities and related TF targets (shuffle = 1)
use GraphLayer = 0
use GraphLayer = 1
association between motif activities and related TF targets (shuffle = 1)
use GraphLayer = 0
use GraphLayer = 1
association between motif activities and related TF targets (shuffle = 1)
use GraphLayer = 0
use GraphLayer = 1
association between motif activities and related TF targets (shuffle = 1)
use GraphLayer = 0
use GraphLayer = 1
association between motif activities and related TF targets (shuffle = 1)
use GraphLayer = 0
use GraphLayer = 1
table = []
for use_graph in [False, True]:
    for thr in range(1, 10):
        sel = res[res['opt_log_dynamic'] == use_graph]
        next_thr = 10 ** (-thr)
        n_pos = sel[sel['p_adj'] < next_thr].shape[0]
        n_neg = [s[(s['p_adj'] < next_thr) & (s['opt_log_dynamic'] == use_graph)].shape[0] for s in shuffled]
        # print(next_thr, n_pos, np.mean(n_neg), np.std(n_neg), (n_pos - np.mean(n_neg)) / np.std(n_neg))
        table.append([next_thr, n_pos, np.mean(n_neg), np.std(n_neg), (n_pos - np.mean(n_neg)) / np.std(n_neg), use_graph])
table = pd.DataFrame(table, columns=['p_adj_thr', 'n_pos', 'mu', 'sigma', 'zscore', 'graph_layer'])
table.pivot(index='graph_layer', columns='p_adj_thr', values='zscore')
| p_adj_thr | 1.000000e-09 | 1.000000e-08 | 1.000000e-07 | 1.000000e-06 | 1.000000e-05 | 1.000000e-04 | 1.000000e-03 | 1.000000e-02 | 1.000000e-01 |
|---|---|---|---|---|---|---|---|---|---|
| graph_layer | |||||||||
| False | 17.060107 | 16.931821 | 16.909936 | 23.185106 | 32.301258 | 29.911232 | 29.329282 | 41.644077 | 42.534653 |
| True | 12.621635 | 12.593050 | 18.507256 | 19.729753 | 22.747781 | 29.313381 | 31.304952 | 32.753934 | 36.483341 |
rcParams['figure.figsize'] = 4, 1
hm = table.pivot(index='graph_layer', columns='p_adj_thr', values='n_pos').fillna(0)
z = table.pivot(index='graph_layer', columns='p_adj_thr', values='zscore').fillna(0)
sns.heatmap(z, annot=hm, fmt='', cmap='Blues', cbar_kws={'label': 'Z-score\n(permutations)'},
            vmin=9,
            vmax=50)
plt.title('associations between activity layer and TF (GEX)')
Text(0.5, 1.0, 'associations between activity layer and TF (GEX)')
cumulative = np.cumsum(res.sort_values('p_adj')['p_adj']) / 100
plt.plot(range(len(cumulative)), cumulative[::-1])
[<matplotlib.lines.Line2D at 0x7dfb68010d90>]
shuffled[0].sort_values('p_val')
| filter_id | opt_log_dynamic | archetype_id | gene_name | matched | spearman | p_val | module_name | p_adj | |
|---|---|---|---|---|---|---|---|---|---|
| 53 | 162 | False | 284 | Tmem38a | True | 0.189496 | 4.325992e-25 | AHR | 9.430663e-23 |
| 30 | 103 | False | 165 | Tmed3 | True | 0.149529 | 4.077543e-16 | RBPJ | 4.444522e-14 |
| 125 | 80 | True | 113 | Mycl | True | 0.138851 | 4.374617e-14 | GC-tract | 3.178888e-12 |
| 10 | 48 | False | 87 | Meis2 | True | 0.127956 | 3.605791e-12 | FOX/6 | 1.965156e-10 |
| 187 | 203 | True | 36 | Hlf | True | 0.119320 | 9.225166e-11 | NR/7 | 4.022172e-09 |
| ... | ... | ... | ... | ... | ... | ... | ... | ... | ... |
| 133 | 91 | True | 58 | Irf8 | True | NaN | 1.000000e+00 | Ebox/CACGTG/1 | 1.000000e+00 |
| 116 | 64 | True | 98 | Art3 | True | NaN | 1.000000e+00 | ETS/1 | 1.000000e+00 |
| 167 | 149 | True | 45 | Tbc1d1 | True | NaN | 1.000000e+00 | NR/16 | 1.000000e+00 |
| 211 | 266 | True | 112 | Tbc1d1 | True | NaN | 1.000000e+00 | KLF/SP/1 | 1.000000e+00 |
| 147 | 101 | True | 95 | Tmem33 | True | NaN | 1.000000e+00 | SPI | 1.000000e+00 |
218 rows × 9 columns
res.sort_values('p_adj')
| filter_id | opt_log_dynamic | archetype_id | gene_name | matched | spearman | p_val | module_name | p_adj | |
|---|---|---|---|---|---|---|---|---|---|
| 543 | 127 | False | 128 | Nfia | True | 0.243690 | 7.152633e-41 | NFI/3 | 4.403068e-38 |
| 139 | 48 | False | 49 | Fos | True | 0.243386 | 9.022680e-41 | CREB/ATF/1 | 4.403068e-38 |
| 356 | 88 | False | 89 | Sox4 | True | 0.244228 | 4.743278e-41 | SOX/1 | 4.403068e-38 |
| 235 | 58 | False | 59 | Mycn | True | 0.230975 | 8.795235e-37 | Ebox/CACGTG/2 | 3.219056e-34 |
| 276 | 67 | False | 68 | Id4 | True | 0.215758 | 3.333383e-32 | Ebox/CACCTG | 9.760147e-30 |
| ... | ... | ... | ... | ... | ... | ... | ... | ... | ... |
| 843 | 44 | True | 45 | Rxrb | True | 0.000601 | 9.740748e-01 | NR/16 | 1.000000e+00 |
| 846 | 44 | True | 45 | Thbs3 | True | 0.000092 | 9.960389e-01 | NR/16 | 1.000000e+00 |
| 861 | 45 | True | 46 | Ppargc1a | True | NaN | 1.000000e+00 | NR/17 | 1.000000e+00 |
| 880 | 49 | True | 50 | Atf7 | True | NaN | 1.000000e+00 | CREB/ATF/2 | 1.000000e+00 |
| 1463 | 284 | True | 285 | Klf8 | True | -0.000245 | 9.894223e-01 | KLF/SP/3 | 1.000000e+00 |
1464 rows × 9 columns
from statsmodels.stats.multitest import fdrcorrection
res['p_adj'] = fdrcorrection(res['p_val'])[1]
# res[res['p_adj'] < 0.1]
genes_by_module_name = res.groupby(['module_name'])['gene_name'].apply(lambda grp: list(grp.value_counts().index)).to_dict()
# genes_by_module_name
res[res['gene_name'] == 'Malat1']
| filter_id | opt_log_dynamic | archetype_id | gene_name | matched | spearman | p_val | module_name | p_adj |
|---|
res.sort_values('p_adj')
| filter_id | opt_log_dynamic | archetype_id | gene_name | matched | spearman | p_val | module_name | p_adj | |
|---|---|---|---|---|---|---|---|---|---|
| 543 | 127 | False | 128 | Nfia | True | 0.243690 | 7.152633e-41 | NFI/3 | 4.403068e-38 |
| 139 | 48 | False | 49 | Fos | True | 0.243386 | 9.022680e-41 | CREB/ATF/1 | 4.403068e-38 |
| 356 | 88 | False | 89 | Sox4 | True | 0.244228 | 4.743278e-41 | SOX/1 | 4.403068e-38 |
| 235 | 58 | False | 59 | Mycn | True | 0.230975 | 8.795235e-37 | Ebox/CACGTG/2 | 3.219056e-34 |
| 276 | 67 | False | 68 | Id4 | True | 0.215758 | 3.333383e-32 | Ebox/CACCTG | 9.760147e-30 |
| ... | ... | ... | ... | ... | ... | ... | ... | ... | ... |
| 843 | 44 | True | 45 | Rxrb | True | 0.000601 | 9.740748e-01 | NR/16 | 1.000000e+00 |
| 846 | 44 | True | 45 | Thbs3 | True | 0.000092 | 9.960389e-01 | NR/16 | 1.000000e+00 |
| 861 | 45 | True | 46 | Ppargc1a | True | NaN | 1.000000e+00 | NR/17 | 1.000000e+00 |
| 880 | 49 | True | 50 | Atf7 | True | NaN | 1.000000e+00 | CREB/ATF/2 | 1.000000e+00 |
| 1463 | 284 | True | 285 | Klf8 | True | -0.000245 | 9.894223e-01 | KLF/SP/3 | 1.000000e+00 |
1464 rows × 9 columns
res['k'] = res['gene_name'] + '_' + res['archetype_id'].astype(str)
df2 = res.pivot(index='k', columns='opt_log_dynamic', values='spearman')
# df2 = res # .pivot(index='k', columns='opt_log_dynamic', values='spearman')
df2
| opt_log_dynamic | False | True |
|---|---|---|
| k | ||
| Ahr_284 | 0.006393 | 0.011032 |
| Ap2a1_264 | 0.083824 | 0.006813 |
| Ap2a2_264 | 0.134813 | 0.045443 |
| Ap2b1_264 | 0.102018 | 0.044073 |
| Arid3a_24 | -0.042556 | -0.004621 |
| ... | ... | ... |
| Zic1_110 | -0.058097 | 0.004931 |
| Zic1_273 | -0.079573 | -0.013797 |
| Zic2_273 | -0.008657 | -0.013349 |
| Zic3_273 | -0.022379 | 0.011151 |
| Zic4_273 | -0.041769 | -0.012468 |
732 rows × 2 columns
mb.pl.set_rcParams({'figure.figsize': [5, 4], 'figure.dpi': 120})
# df2 = df2.sort_values('matched', ascending=True)
# plt.scatter(df2[True], df2[True],
#             color=np.where(df2['matched'], 'blue', 'gray'),
#             s=np.where(df2['matched'], 30, 5))
# plt.xlabel('TF activity (graph = off)')
# plt.ylabel('TF activity (graph = on)')
# plt.axhline(0, color='gray', ls='--', zorder=0)
# plt.axvline(0, color='gray', ls='--', zorder=0)
# df2[df2['matched'] == True].sort_values(True, ascending=False)
# res['arch_name'] = name_by_filter_id
res.sort_values('p_adj')
| filter_id | opt_log_dynamic | archetype_id | gene_name | matched | spearman | p_val | module_name | p_adj | k | |
|---|---|---|---|---|---|---|---|---|---|---|
| 543 | 127 | False | 128 | Nfia | True | 0.243690 | 7.152633e-41 | NFI/3 | 4.403068e-38 | Nfia_128 |
| 139 | 48 | False | 49 | Fos | True | 0.243386 | 9.022680e-41 | CREB/ATF/1 | 4.403068e-38 | Fos_49 |
| 356 | 88 | False | 89 | Sox4 | True | 0.244228 | 4.743278e-41 | SOX/1 | 4.403068e-38 | Sox4_89 |
| 235 | 58 | False | 59 | Mycn | True | 0.230975 | 8.795235e-37 | Ebox/CACGTG/2 | 3.219056e-34 | Mycn_59 |
| 276 | 67 | False | 68 | Id4 | True | 0.215758 | 3.333383e-32 | Ebox/CACCTG | 9.760147e-30 | Id4_68 |
| ... | ... | ... | ... | ... | ... | ... | ... | ... | ... | ... |
| 843 | 44 | True | 45 | Rxrb | True | 0.000601 | 9.740748e-01 | NR/16 | 1.000000e+00 | Rxrb_45 |
| 846 | 44 | True | 45 | Thbs3 | True | 0.000092 | 9.960389e-01 | NR/16 | 1.000000e+00 | Thbs3_45 |
| 861 | 45 | True | 46 | Ppargc1a | True | NaN | 1.000000e+00 | NR/17 | 1.000000e+00 | Ppargc1a_46 |
| 880 | 49 | True | 50 | Atf7 | True | NaN | 1.000000e+00 | CREB/ATF/2 | 1.000000e+00 | Atf7_50 |
| 1463 | 284 | True | 285 | Klf8 | True | -0.000245 | 9.894223e-01 | KLF/SP/3 | 1.000000e+00 | Klf8_285 |
1464 rows × 10 columns
rcParams['figure.figsize'] = 4, 4
rcParams['figure.dpi'] = 90
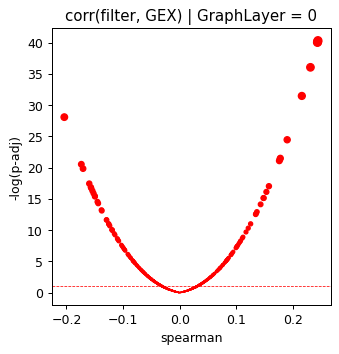
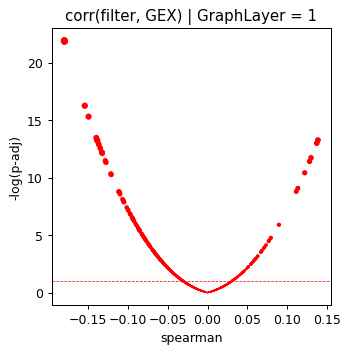
for optimize_log_dynamic, grp in res.groupby('opt_log_dynamic'):
grp['minus_log10_pval'] = -np.log10(grp['p_val'])
grp = grp.sort_values('matched')
plt.scatter(grp['spearman'], grp['minus_log10_pval'],
s=np.power(grp['minus_log10_pval'], 1), color=np.where(grp['matched'], 'red', 'blue'))
plt.ylabel('-log(p-adj)')
plt.xlabel('spearman')
plt.title('corr(filter, GEX) | GraphLayer = %i' % optimize_log_dynamic)
plt.axhline(1, ls='--', color='red', lw=0.6)
plt.show()
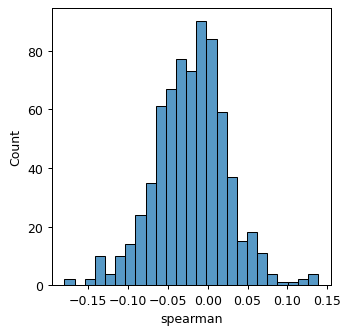
sns.histplot(grp['spearman'])
<Axes: xlabel='spearman', ylabel='Count'>
# sc.pl.umap(ad, color=[96], cmap='RdBu_r')
# sc.pl.umap(rna_sel, color=['Ehf', 'Ergic2'], cmap='plasma')
rcParams['figure.figsize'] = 3, 3
rcParams['figure.dpi'] = 90
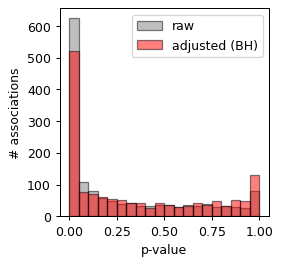
plt.hist(res['p_val'], color='gray', bins=20, label='raw', alpha=.5, edgecolor = 'black')
plt.hist(res['p_adj'], color='red', bins=20, label='adjusted (BH)', alpha=.5, edgecolor = 'black')
plt.xlabel('p-value')
plt.legend()
plt.ylabel('# associations')
Text(0, 0.5, '# associations')
res[res['p_adj'] < 0.05]
| filter_id | opt_log_dynamic | archetype_id | gene_name | matched | spearman | p_val | module_name | p_adj | k | |
|---|---|---|---|---|---|---|---|---|---|---|
| 8 | 1 | False | 2 | Lhx2 | True | -0.089777 | 0.000001 | HD/2 | 0.000012 | Lhx2_2 |
| 11 | 1 | False | 2 | Prrx2 | True | -0.053156 | 0.004000 | HD/2 | 0.014827 | Prrx2_2 |
| 18 | 1 | False | 2 | Emx1 | True | -0.050537 | 0.006216 | HD/2 | 0.021465 | Emx1_2 |
| 20 | 1 | False | 2 | Meox1 | True | -0.043850 | 0.017610 | HD/2 | 0.049578 | Meox1_2 |
| 22 | 1 | False | 2 | Dlx2 | True | -0.044838 | 0.015214 | HD/2 | 0.043932 | Dlx2_2 |
| ... | ... | ... | ... | ... | ... | ... | ... | ... | ... | ... |
| 1444 | 261 | True | 262 | Zbtb7c | True | -0.044695 | 0.015541 | GLI | 0.044437 | Zbtb7c_262 |
| 1448 | 263 | True | 264 | Ap2b1 | True | 0.044073 | 0.017043 | TFAP2/1 | 0.048167 | Ap2b1_264 |
| 1449 | 263 | True | 264 | Ap2a2 | True | 0.045443 | 0.013893 | TFAP2/1 | 0.041289 | Ap2a2_264 |
| 1451 | 265 | True | 266 | Insm1 | True | -0.050142 | 0.006633 | INSM1 | 0.022635 | Insm1_266 |
| 1460 | 280 | True | 281 | Pax6 | True | -0.058318 | 0.001588 | PAX/1 | 0.006789 | Pax6_281 |
521 rows × 10 columns
pval_thr = 1e-5
sel_genes = set(list(res[res['p_adj'] < pval_thr]['gene_name']))
log_act = ad.obsm['log_activities'].copy()
cols_act = ['intercept', 'dinuc_bias'] + [name_by_filter_id[k] for k in log_act.columns[2:]]
log_act.columns = cols_act
import anndata
ad_act = anndata.AnnData(log_act)
ad_act.obsm['X_umap'] = ad.obsm['X_umap']
ad_act.obs = ad.obs
sc.pl.umap(ad_act, color=cell_type_key)
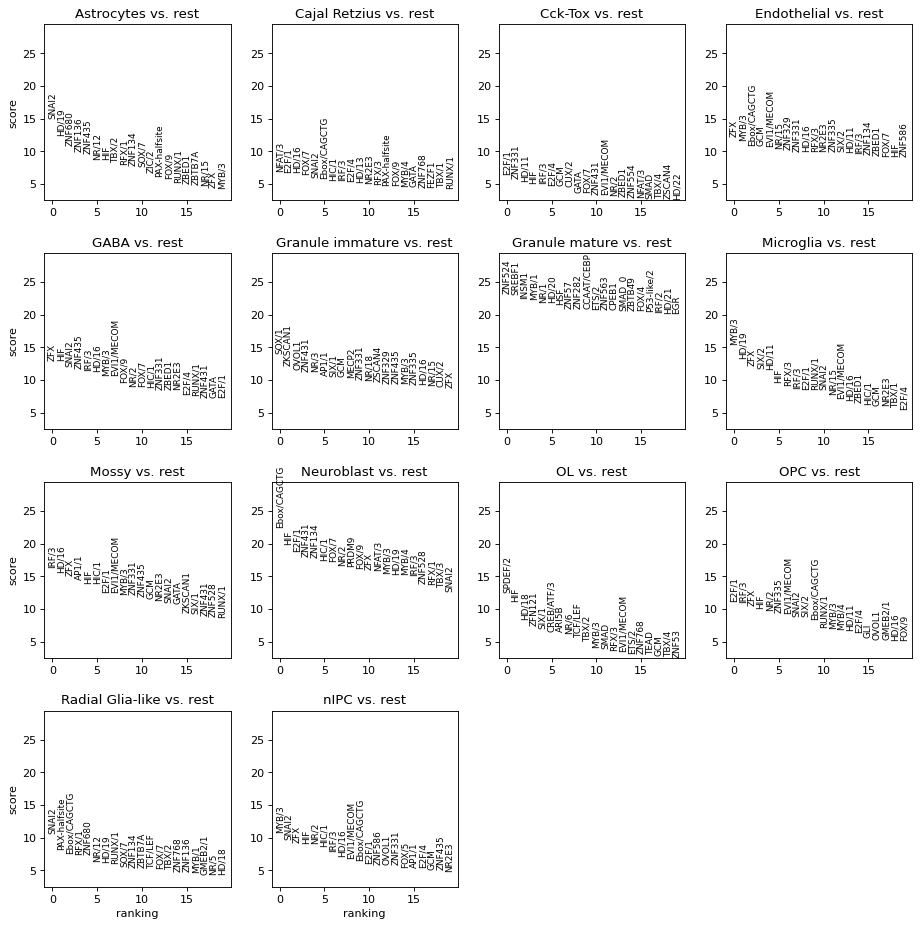
Rank genes groups using the annotation
sc.tl.rank_genes_groups(ad_act, cell_type_key)
rkg_df = []
for ct in ad_act.obs[cell_type_key].values.unique():
    print(ct)
    rkg_df2 = sc.get.rank_genes_groups_df(ad_act, ct)
    rkg_df2[cell_type_key] = ct
    rkg_df.append(rkg_df2)
rkg_df = pd.concat(rkg_df)
rkg_df['module_name'] = rkg_df['names'].map(anno.set_index('Cluster_ID')['Name'].to_dict())
rkg_df['module_name'] = np.where(~pd.isnull(rkg_df['module_name']), rkg_df['module_name'], rkg_df['names'])
rkg_df.head()
Granule immature
Radial Glia-like
Granule mature
Neuroblast
Microglia
Cajal Retzius
OPC
Cck-Tox
GABA
Endothelial
Astrocytes
OL
Mossy
nIPC
| names | scores | logfoldchanges | pvals | pvals_adj | clusters | module_name | |
|---|---|---|---|---|---|---|---|
| 0 | SOX/1 | 13.993413 | NaN | 2.453977e-42 | 7.067453e-40 | Granule immature | SOX/1 |
| 1 | ZKSCAN1 | 12.138745 | NaN | 1.373464e-32 | 9.888943e-31 | Granule immature | ZKSCAN1 |
| 2 | OVOL1 | 11.670671 | NaN | 1.838188e-30 | 6.617477e-29 | Granule immature | OVOL1 |
| 3 | ZNF431 | 11.298390 | NaN | 1.136821e-28 | 2.976403e-27 | Granule immature | ZNF431 |
| 4 | NR/3 | 11.296875 | NaN | 1.425543e-28 | 3.421303e-27 | Granule immature | NR/3 |
Get top modules
ad_act.var_names = ad_act.var_names.map(rkg_df.set_index('names')['module_name'].to_dict())
sc.tl.rank_genes_groups(ad_act, cell_type_key)
rcParams['figure.figsize'] = 3.5, 3.5
rcParams['figure.dpi'] = 80
sc.pl.rank_genes_groups(ad_act)
set(res[(res['p_adj'] < 1e-5)]['k'])
{'Ap2a2_264',
 'Ap2b1_264',
 'Arnt2_58',
 'Arxes1_2',
 'Arxes1_8',
 'Atf2_49',
 'Atf4_51',
 'Bach2_53',
 'Cpeb1_23',
 'Creb1_49',
 'Creb3_50',
 'Dbpht2_52',
 'E2f1_156',
 'E2f3_156',
 'Elk1_98',
 'Emx1_7',
 'Ergic1_98',
 'Ergic2_96',
 'Ets1_98',
 'Etv3_98',
 'Fos_49',
 'Fosb_49',
 'Foxj3_80',
 'Foxk2_79',
 'Foxo1_77',
 'Foxq1_80',
 'Gata2_242',
 'Grhl1_258',
 'Hes1_59',
 'Id4_68',
 'Irf2bp2_104',
 'Jun_54',
 'Junb_50',
 'Junb_54',
 'Jund_49',
 'Klf6_109',
 'Lef1_29',
 'Maf1_55',
 'Mafb_55',
 'Maff_55',
 'Mafk_55',
 'Mef2a_183',
 'Mgat1_71',
 'Mgat1_73',
 'Mgat3_71',
 'Mgat3_73',
 'Mgat4b_71',
 'Mgat4b_73',
 'Mgat4c_71',
 'Mgat4c_73',
 'Mgat5b_71',
 'Mgat5b_73',
 'Mlx_58',
 'Mycl_59',
 'Mycn_59',
 'Neurog2_62',
 'Nfe2l1_54',
 'Nfe2l2_53',
 'Nfia_128',
 'Nfia_188',
 'Nfia_189',
 'Nfix_189',
 'Nfya_13',
 'Nr1h2_30',
 'Nr2e1_43',
 'Nr2f1_30',
 'Nr2f1_41',
 'Nr2f1_42',
 'Nr3c2_248',
 'Olig1_62',
 'Pbx1_12',
 'Pbx1_21',
 'Pou6f1_2',
 'Rell2_160',
 'Rfx3_247',
 'Runx1t1_179',
 'Smad3_129',
 'Sox10_93',
 'Sox11_94',
 'Sox12_92',
 'Sox12_93',
 'Sox17_202',
 'Sox17_89',
 'Sox17_92',
 'Sox17_94',
 'Sox18_92',
 'Sox21_92',
 'Sox21_93',
 'Sox2_84',
 'Sox2_89',
 'Sox2_92',
 'Sox2_93',
 'Sox2_94',
 'Sox4_89',
 'Sox4_93',
 'Sox9_89',
 'Sox9_92',
 'Sox9_93',
 'Sox9_94',
 'Srebf2_58',
 'Tcf4_68',
 'Tef_52',
 'Tfap2c_264',
 'Tgif1_69',
 'Tgif2_69',
 'Thra_34',
 'Thrb_34',
 'Thrb_37',
 'Vezf1_109',
 'Xbp1_50',
 'Zbtb18_65',
 'Zfp428_145'}
res[res['module_name'].str.contains('HD')].sort_values('p_adj')
| filter_id | opt_log_dynamic | archetype_id | gene_name | matched | spearman | p_val | module_name | p_adj | k | |
|---|---|---|---|---|---|---|---|---|---|---|
| 766 | 11 | True | 12 | Pbx1 | True | -0.149060 | 5.044511e-16 | HD/12 | 2.954066e-14 | Pbx1_12 |
| 29 | 6 | False | 7 | Emx1 | True | -0.145162 | 2.878569e-15 | HD/7 | 1.505080e-13 | Emx1_7 |
| 32 | 7 | False | 8 | Arxes1 | True | -0.138045 | 6.138845e-14 | HD/8 | 2.567791e-12 | Arxes1_8 |
| 34 | 11 | False | 12 | Pbx1 | True | -0.129060 | 2.343838e-12 | HD/12 | 6.862757e-11 | Pbx1_12 |
| 764 | 7 | True | 8 | Arxes1 | True | -0.110658 | 1.904212e-09 | HD/8 | 3.767252e-08 | Arxes1_8 |
| ... | ... | ... | ... | ... | ... | ... | ... | ... | ... | ... |
| 782 | 20 | True | 21 | Pbx2 | True | -0.000733 | 9.683435e-01 | HD/16 | 1.000000e+00 | Pbx2_21 |
| 25 | 4 | False | 5 | Msx1 | True | NaN | 1.000000e+00 | HD/5 | 1.000000e+00 | Msx1_5 |
| 757 | 4 | True | 5 | Msx1 | True | NaN | 1.000000e+00 | HD/5 | 1.000000e+00 | Msx1_5 |
| 12 | 1 | False | 2 | Arid3b | True | 0.001105 | 9.523369e-01 | HD/2 | 1.000000e+00 | Arid3b_2 |
| 745 | 1 | True | 2 | Msx1 | True | NaN | 1.000000e+00 | HD/2 | 1.000000e+00 | Msx1_2 |
86 rows × 10 columns
mod_names_best = set(rkg_df.sort_values('scores', ascending=False).groupby(cell_type_key).head(5)['module_name'])
best = rkg_df[rkg_df['module_name'].isin(mod_names_best)]
rcParams['figure.dpi'] = 130
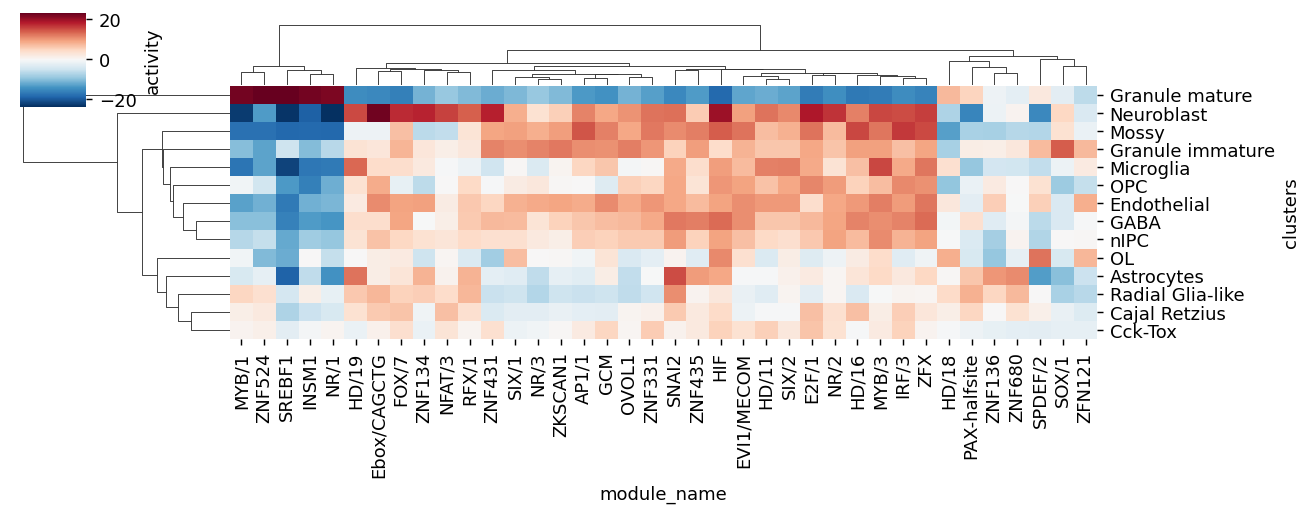
sns.clustermap(best.pivot(index=cell_type_key, columns='module_name', values='scores'),
cbar_kws={'label': 'activity'}, cmap='RdBu_r',
# vmin=-5, vmax=5,
figsize=[10.2, 4],
# dpi=100,
xticklabels=True)
<seaborn.matrix.ClusterGrid at 0x7dfb7774f370>
rna_tfs = rna_sel.to_df()[list(set(res['gene_name']))]
rna_tfs[cell_type_key] = rna_sel.obs[cell_type_key]
mean_tfs = rna_tfs.groupby(cell_type_key).mean()

act_tfs_df = ad_act.to_df()
act_tfs_df[cell_type_key] = ad_act.obs[cell_type_key]
mean_act_tf = act_tfs_df.groupby(cell_type_key).mean()
corr_celltype = []
for i, c1 in enumerate(mean_act_tf):
    if i % 50 == 0:
        print(i, mean_act_tf.shape[1])
    for j, c2 in enumerate(mean_tfs):
        if not c1 in genes_by_module_name or not c2 in genes_by_module_name[c1]:
            continue
        a = mean_act_tf[c1]
        b = mean_tfs[c2]
        corr_celltype.append([c1, c2, mean_act_tf.index[np.argmax(mean_act_tf[c1])]] + list(pearsonr(a, b)))

corr = pd.DataFrame(corr_celltype,
                    columns=['module_name', 'gene_name', 'cell_type', 'pearsonr', 'p_val'])
corr = corr.sort_values('pearsonr', ascending=False)
0 288
50 288
100 288
150 288
200 288
250 288
# sc.pl.dotplot(rna_sel, groupby='celltype', var_names=list(set(res['gene_name'])))
corr[corr['pearsonr'] > 0].sort_values('p_val')
| module_name | gene_name | cell_type | pearsonr | p_val | |
|---|---|---|---|---|---|
| 535 | CPEB1 | Cpeb1 | Granule mature | 0.782779 | 0.000933 |
| 352 | ZIC/2 | Zic1 | Endothelial | 0.727187 | 0.003209 |
| 233 | TATA | Tbp | Radial Glia-like | 0.718467 | 0.003795 |
| 688 | CCAAT/CEBP | Dbpht2 | Granule mature | 0.701853 | 0.005143 |
| 312 | NR/11 | Nr6a1 | Cck-Tox | 0.685091 | 0.006856 |
| ... | ... | ... | ... | ... | ... |
| 548 | FOX/7 | Foxo6 | Endothelial | 0.006682 | 0.981913 |
| 49 | HD/2 | Arxes2 | Cck-Tox | 0.005040 | 0.986358 |
| 509 | GC-tract | Taf1a | Endothelial | 0.003260 | 0.991176 |
| 240 | NFKB/1 | Relb | Radial Glia-like | 0.001938 | 0.994753 |
| 248 | Ebox/CAGATGG | Olig2 | Granule mature | 0.000985 | 0.997334 |
322 rows × 5 columns
from matplotlib.pyplot import rcParams
rcParams['figure.dpi'] = 150
# repressors
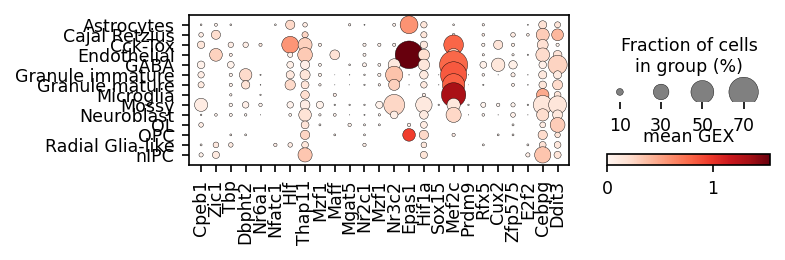
module_names = corr[corr['pearsonr'] < 0].sort_values('p_val').sort_values('p_val').groupby('cell_type').head(3)['module_name'].drop_duplicates()
gene_names = corr[corr['pearsonr'] < 0].sort_values('p_val').sort_values('p_val').groupby('cell_type').head(3)['gene_name']
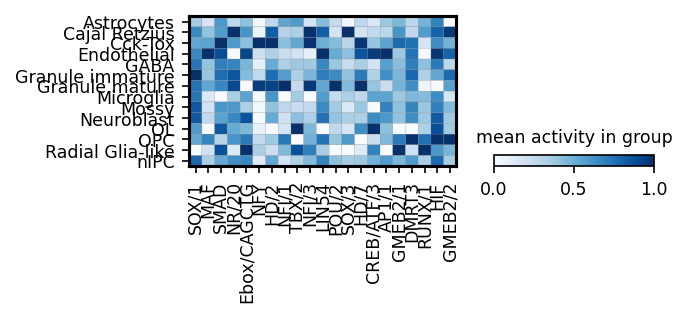
sc.pl.matrixplot(ad_act,
groupby=cell_type_key,
cmap='Blues',
var_names=module_names,
figsize=[4, 1.3],
standard_scale='var',
colorbar_title='mean activity in group')
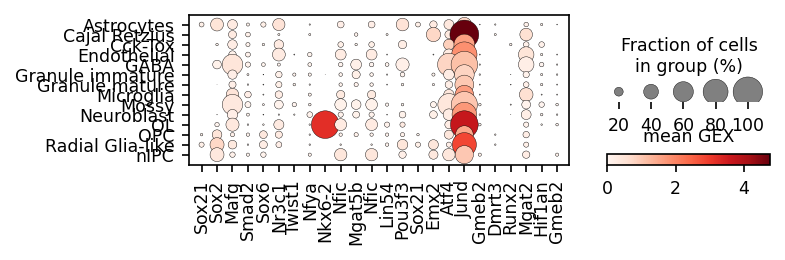
sc.pl.dotplot(rna_sel,
groupby=cell_type_key,
colorbar_title='mean GEX',
var_names=gene_names,
figsize=[5, 1.3])
# activators
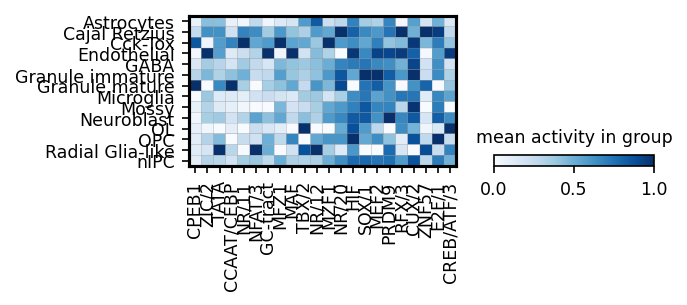
module_names = corr[corr['pearsonr'] > 0].sort_values('p_val').sort_values('p_val').groupby('cell_type').head(3)['module_name'].drop_duplicates()
gene_names   = corr[corr['pearsonr'] > 0].sort_values('p_val').sort_values('p_val').groupby('cell_type').head(3)['gene_name']
sc.pl.matrixplot(ad_act,
            groupby=cell_type_key,
            cmap='Blues',
            var_names=module_names,
            figsize=[4, 1.3],
            standard_scale='var',
            colorbar_title='mean activity in group')
sc.pl.dotplot(rna_sel,
              groupby=cell_type_key,
              colorbar_title='mean GEX',
              var_names=gene_names,
              figsize=[5, 1.3])
filter_id_by_name = {v: k for k, v in zip(name_by_filter_id.keys(), name_by_filter_id.values())}
print(module_names.map(res.set_index('module_name')['filter_id'].to_dict()))
mb.pl.set_rcParams({"figure.figsize": [2, 20], "figure.dpi": 90})
mb.pl.logo(
    model,
    title=False,
    xticks=False,
    rowspan_dinuc=0,
    rowspan_mono=1,
    n_rows=40,
    log_odds=True,
    # stop_at=11,
    show=False,
    # n_rows=len(res.head(20).index),
    n_cols=1,
    order=module_names.map(filter_id_by_name) + 2,
)  # n_cols=len(reduced_groups))
# plt.tight_layout()

plt.savefig('../../../output/motif_dentategyrus_publication.pdf')
plt.show()
535     22
352    109
233    181
688     51
312     39
625    101
499    112
82     198
515     54
655     70
665     40
470    113
693    247
338     59
220     88
129    182
140    130
576    245
33      15
606    217
215    185
656     50
Name: module_name, dtype: int64
delta_model
HD/1    0.037209
HD/2    0.010972
HD/3    0.105572
HD/4    0.030862
HD/5    0.075392
          ...
NaN     0.037915
NaN     0.000276
NaN     0.086250
NaN     0.294980
NaN     0.019049
Length: 2928, dtype: float32
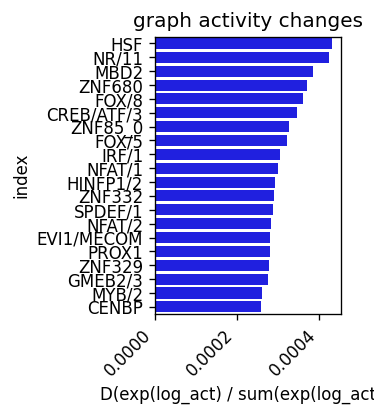
def delta_models(model_by_logdynamic, func='mean'):
    model = model_by_logdynamic[True]
    model = model_by_logdynamic[True]

    log_act1 = torch.stack(list(model.activities.log_activities), dim=1).squeeze(0)
    if func == 'expsum':
        log_act1 = log_act1.exp() / log_act1.exp().sum()
    log_act1 = pd.DataFrame(log_act1.detach().cpu().numpy())

    model = model_by_logdynamic[False]
    log_act2 = torch.stack(list(model.activities.log_activities), dim=1).squeeze(0)
    if func == 'expsum':
        log_act2 = log_act2.exp() / log_act2.exp().sum()
    log_act2 = pd.DataFrame(log_act2.detach().cpu().numpy())

    d = None
    if func == 'mean':
        d = log_act1.mean(axis=0) - log_act2.mean(axis=0)
        d = pd.DataFrame(d, columns=['delta'])
        d['graph_on'] = log_act1.mean(axis=0)
        d['graph_off'] = log_act2.mean(axis=0)
        return d
    elif func == 'abssum' or func == 'expsum':
        d = log_act1.abs().sum(axis=0) - log_act2.abs().sum(axis=0)
        d = pd.DataFrame(d, columns=['delta'])
        d['graph_on'] = log_act1.abs().sum(axis=0)
        d['graph_off'] = log_act2.abs().sum(axis=0)
        return d


# graph = True - graph = False
delta_model = delta_models(model_by_logdynamic, func='expsum')
delta_model
delta_model = delta_model[2:]
delta_model.index = range(len(delta_model))
delta_model.index += 1
delta_model.index = delta_model.index.map(name_by_filter_id)
delta_model
n_select = 20
top_delta = delta_model.sort_values('delta', ascending=False).reset_index()['index'][:n_select]
bar_df = delta_model.sort_values('delta', ascending=False).reset_index().melt(id_vars='index', value_vars=['graph_on', 'graph_off'])
rcParams['figure.dpi'] = 120
rcParams['figure.figsize'] = 2, 3

motifs = delta_model.sort_values('delta', ascending=0).reset_index().head(20)
sns.barplot(data=motifs, x='delta', y='index', color='blue')
plt.title('graph activity changes')
plt.xticks(rotation=45, ha='right')
plt.xlabel('D(exp(log_act) / sum(exp(log_act)))')
plt.savefig('../../../output/delta_log_act_exp_dentate_gyrus.pdf')
plt.show()
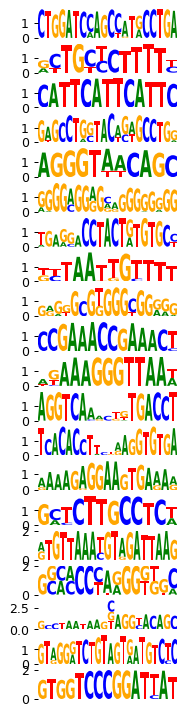
module_names = motifs['index']
print(motifs['index'].map(res.set_index('module_name')['filter_id'].to_dict()))
mb.pl.set_rcParams({"figure.figsize": [2, 20], "figure.dpi": 90})
mb.pl.logo(
    model,
    title=False,
    xticks=False,
    rowspan_dinuc=0,
    rowspan_mono=1,
    n_rows=40,
    log_odds=True,
    # stop_at=11,
    show=False,
    # n_rows=len(res.head(20).index),
    n_cols=1,
    order=module_names.map(filter_id_by_name) + 2,
)  # n_cols=len(reduced_groups))
# plt.tight_layout()

plt.savefig('../../../output/motif_dentategyrus_publication_fig1.pdf')
plt.show()
0     248.0
1      39.0
2     238.0
3       NaN
4     202.0
5      50.0
6       NaN
7      79.0
8     103.0
9      99.0
10      NaN
11      NaN
12      NaN
13     98.0
14    240.0
15    237.0
16      NaN
17    277.0
18    253.0
19    199.0
Name: index, dtype: float64
Filter activities versus graph activities
A = model.get_log_activities()
sum_A = A.abs().sum(axis=1).cpu().detach().numpy()
A = A.squeeze(0)
print(A.shape)
torch.Size([288, 2930])
# this function assesses the contributions of A on the graph
indices, contributions, max_eig = mb.tl.compute_contributions(A.cpu(), C.cpu(), D.cpu())

contributions_normalized = torch.abs(contributions) / max_eig
contributions_df = pd.DataFrame(contributions_normalized.detach(), columns=['index'])
print("Summary statistics of the normalized contributions: \n")
contributions_df.describe()
Summary statistics of the normalized contributions:
| index | |
|---|---|
| count | 288.000000 |
| mean | 0.269337 |
| std | 0.022807 |
| min | 0.204156 |
| 25% | 0.253737 |
| 50% | 0.267314 |
| 75% | 0.283786 |
| max | 0.355356 |
contributions.shape
torch.Size([288])
from matplotlib.pyplot import rcParams
rcParams['figure.dpi'] = 100
plt.figure(figsize=(10, 5))

print(f"Percentage of non-zero entries of the filter matrix A: {100 * torch.sum(A != 0).item() / A.numel()} %")
mb.pl.filter_contrib_simple(contributions_normalized, A.cpu())
Percentage of non-zero entries of the filter matrix A: 100.0 %
<Figure size 1000x500 with 0 Axes>
# normalize the data, and look at summary stats
sum_A_norm = sum_A / np.max(sum_A)
sum_A_df = pd.DataFrame(sum_A.T, columns=['sum_A'])
sum_A_df.describe()
| sum_A | |
|---|---|
| count | 288.000000 |
| mean | 10.922637 |
| std | 18.310072 |
| min | 0.000380 |
| 25% | 1.822716 |
| 50% | 4.623916 |
| 75% | 12.069072 |
| max | 133.253357 |
contrib_arr = contributions_normalized.unsqueeze(dim=0).detach().numpy()
sum_A = A.cpu().abs().sum(axis=1).detach().numpy()
contrib = contrib_arr[0]

contrib_times_activities = contrib * sum_A
contrib_times_activities_norm = contrib_times_activities / np.max(contrib_times_activities)
contrib_times_activities_df = pd.DataFrame(contrib_times_activities, columns=['contribution_times_activities'])
contrib_times_activities_df.describe()
| contribution_times_activities | |
|---|---|
| count | 288.000000 |
| mean | 2.795332 |
| std | 4.376876 |
| min | 0.000109 |
| 25% | 0.500195 |
| 50% | 1.247980 |
| 75% | 3.171744 |
| max | 28.880850 |
from matplotlib.pyplot import rcParams
rcParams['figure.dpi'] = 60

# unsqueeze the data to make it compatible with the heatmap function
sum_A_norm = sum_A_norm.reshape(1,-1)
contrib_times_activities = contrib_times_activities.reshape(1,-1)


# # only plotting filters, that are within the top 25% of the maximum contribution score
# mb.pl.contrib_heatmaps(contributions_normalized,
#                        sum_A.reshape(1, -1),
#                        contrib_times_activities,
#                        cmap='Reds')
#                        # (0.66, 11.85, 6.49),
#                        # (0.66, 11.85, 6.49)) # vmin values come from the describe() functions

# # plotting top 25% of filters normalized
# mb.pl.contrib_heatmaps(contributions_normalized,
#                        sum_A_norm,
#                        contrib_times_activities_norm.reshape(1,-1),
#                        cmap='Reds')
#                        # vmins=(0.66, 0.14, 0.19),
#                        # centers=(0.66, 0.14, 0.19)) # vmin values come from the describe() functions

# # plotting all filter
# mb.pl.contrib_heatmaps(contributions_normalized,
#                        sum_A.reshape(1, -1),
#                        contrib_times_activities,
#                        cmap='Reds')

# # plotting all filters normalized
# mb.pl.contrib_heatmaps(contributions_normalized,
#                        sum_A_norm,
#                        contrib_times_activities,
#                        cmap='Reds')
rcParams['figure.figsize'] = 3, 3
rcParams['figure.dpi'] = 135
from adjustText import adjust_text

def delta_models(model_by_logdynamic):
    model = model_by_logdynamic[True]
    log_act1 = torch.stack(list(model.activities.log_activities), dim=1).squeeze(0).T
    log_act1 = pd.DataFrame(log_act1.detach().cpu().numpy())

    model = model_by_logdynamic[False]
    log_act2 = torch.stack(list(model.activities.log_activities), dim=1).squeeze(0).T
    log_act2 = pd.DataFrame(log_act2.detach().cpu().numpy())

    d = log_act1.mean(axis=0) - log_act2.mean(axis=0)
    # d.index = ad.obs_names
    return d

# graph = True - graph = False
delta_model = delta_models(model_by_logdynamic)
delta_model
delta_model = delta_model[2:]
delta_model.index = range(len(delta_model))
delta_model.index += 1
delta_model.index = delta_model.index.map(name_by_filter_id)
delta_model

res['act_change'] = res['module_name'].map(delta_model.to_dict())
res['k'] = res['module_name'] + ':' + res['gene_name']
res['graph_score'] = res['filter_id'].map({i : contrib_times_activities[0][i + 2] for i in range(len(contrib_times_activities[0]) - 2)})
res['z'] = np.sqrt((res['graph_score'] ** 2) * (-np.log(res['p_adj'] + 1e-10)) ** 2)


ax = plt.subplot()
cmap = sns.color_palette('RdBu_r', as_cmap=True)

res_sel = res.sort_values('z', ascending=False)
res_sel = res_sel.sort_values('z', ascending=False) # .drop_duplicates('module_name')
# res_sel = res_sel.drop_duplicates('module_name')

# res_sel['x'] = np.log((res_sel['graph_score'] + 1) * (res_sel['act_change'].abs() + 1))
res_sel['x'] = res_sel['graph_score'] * res_sel['act_change'].abs() * res_sel['spearman'].abs()
plt.scatter(res_sel['x'],
            res_sel['spearman'],
            s=-np.log(res_sel['p_adj'] + 1e-10),
            cmap=cmap,
            lw=.3,
            edgecolors='gray',
            c=res_sel['act_change'])
plt.axhline(y=0, ls='--', c='gray')
plt.xlabel('Graph contribution * abs(activities) * abs(spearman)')
plt.ylabel('TF activity [GEX, act] | Spearman\' rho')


res_sel = res_sel.sort_values('x', ascending=False) # .drop_duplicates('module_name')
texts = [] # [plt.text(x[i], y[i], 'Text%s' %i, ha='center', va='center') for i in range(len(x))]

for ri, r in res_sel.head(10).iterrows():
    print(r['module_name'] + ':' + r['gene_name'], (r['x'], r['spearman']), r['act_change'])
    t = ax.annotate(r['module_name'] + ':' + r['gene_name'], (r['x'], r['spearman']), fontsize=7)
    texts.append(t)
adjust_text(texts, arrowprops=dict(arrowstyle='->'))
SOX/4:Sox2 (0.29021904511666824, -0.17945499298490714) 0.15828736126422882
SOX/4:Sox4 (0.2867422796585311, 0.17730515846715744) 0.15828736126422882
SOX/4:Sox9 (0.20711017691405556, -0.12806518376584686) 0.15828736126422882
SOX/4:Sox9 (0.19266754332544428, -0.11913467850460215) 0.15828736126422882
SOX/3:Sox9 (0.18181930236206786, -0.20368781889738624) 0.07002270966768265
NFKB/1:Rell2 (0.17373504894589661, -0.15685914297322734) 0.26288485527038574
SOX/4:Sox10 (0.17073008908798273, -0.10556980134532477) 0.15828736126422882
NR/20:Nr3c2 (0.17041615393082601, 0.12776960416018712) 0.17156168818473816
SOX/4:Sox12 (0.1641707649287703, 0.10151388740451499) 0.15828736126422882
SOX/4:Sox21 (0.1572416991001044, -0.09722934619125544) 0.15828736126422882
def running_mean(y_in, x_in, N_out=101, sigma=.05):
    '''
    Returns running mean as a Bell-curve weighted average at evenly spaced
    points. Does NOT wrap signal around, or pad with zeros.

    Arguments:
    y_in -- y values, the values to be smoothed and re-sampled
    x_in -- x values for array

    Keyword arguments:
    N_out -- NoOf elements in resampled array.
    sigma -- 'Width' of Bell-curve in units of param x .
    '''
    import numpy as np
    N_in = len(y_in)

    # Gaussian kernel
    x_out = np.linspace(np.min(x_in), np.max(x_in), N_out)
    x_in_mesh, x_out_mesh = np.meshgrid(x_in, x_out)
    gauss_kernel = np.exp(-np.square(x_in_mesh - x_out_mesh) / (2 * sigma**2))
    # Normalize kernel, such that the sum is one along axis 1
    normalization = np.tile(np.reshape(np.sum(gauss_kernel, axis=1), (N_out, 1)), (1, N_in))
    gauss_kernel_normalized = gauss_kernel / normalization
    # Perform running average as a linear operation
    y_out = gauss_kernel_normalized @ y_in

    return y_out, x_out

def plot_pseudotime(rna, gene_name, filter_name, sigma_gex=.05, sigma_filter=.1):
    rcParams['figure.figsize'] = 3, 2
    gene_key = gene_name
    x = rna.obs['velocity_pseudotime']
    y = rna[:,rna.var_names==gene_key].X.A.flatten()
    y = np.log(y)
    y[y == -np.inf] = np.nanmin(y[y != -np.inf])

    y_mean, x_mean = running_mean(y, x, sigma=sigma_gex)
    plt.scatter(x, y, edgecolors=None, color='lightgreen', s=.1)
    plt.plot(x_mean, y_mean, color='green')
    plt.ylabel('')
    plt.title(gene_key)
    plt.ylabel('gene expression [log]')
    plt.xlabel('pseudotime')


    x = ad.obs['velocity_pseudotime']

    plt.show()
    filter_id = int(res[res['module_name'].str.contains(filter_name)]['filter_id'].values[0])

    y= act.T.numpy()[:,filter_id]
    # y = np.abs(y)
    # y = np.log(y)
    # y[y == -np.inf] = np.nanmin(y[y != -np.inf])

    y_mean, x_mean = running_mean(y, x, sigma=sigma_filter)
    # plt.scatter(x, y, edgecolors='black', color='lightgreen', s=.1)
    plt.plot(x_mean, y_mean, color='blue')
    plt.ylabel('')
    plt.title('filter activities %s' % filter_name)
    plt.ylabel('filter activity')
    plt.xlabel('pseudotime')
scv.tl.velocity_pseudotime(rna_sample)
computing terminal states
    identified 4 regions of root cells and 1 region of end points .
    finished (0:00:03) --> added
    'root_cells', root cells of Markov diffusion process (adata.obs)
    'end_points', end points of Markov diffusion process (adata.obs)
plot_pseudotime(rna_sample, 'Ap2b1', 'TFAP2/1', sigma_gex=.05, sigma_filter=.1)
plot_pseudotime(rna_sample, 'Hlf', 'CCAAT/CEBP', sigma_gex=.1, sigma_filter=.2)